July 15, 2020, 11:15 pm
#stayhomebewell
Hello, everyone. It has been a hell of a ride, eh? Hopefully, you’ve been able to navigate the twists and turns a little bit better as a result of my efforts. Not that the results have been any different, but perhaps you were less shocked than you might otherwise have been for having read my posts, lo these many weeks.
I’m posting today because we’ve reached a projection milestone. After we reached my last milestone of 1,500,000 cases on May 13, I predicted a level of 3,500,000 cases by July 29. We reached that level yesterday.
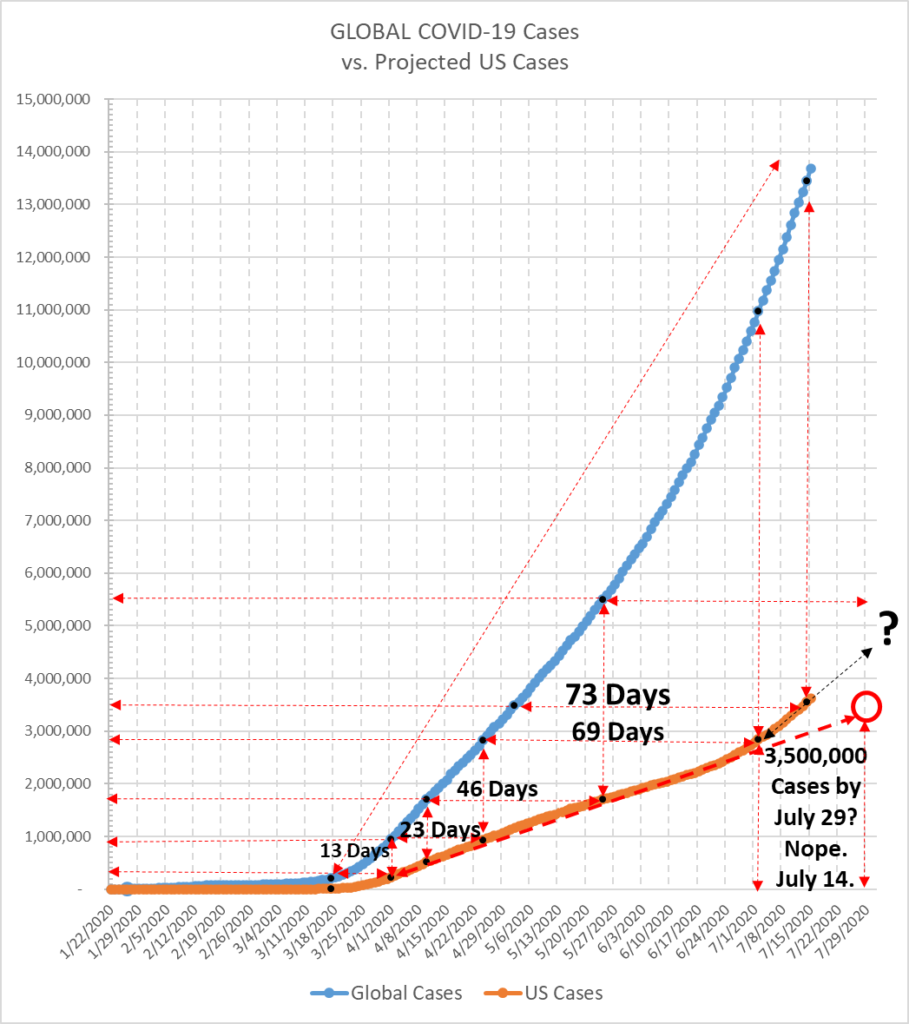
I explained my method of triangulating points on June 24, and somewhere earlier in my posts, I don’t remember when exactly. As you can see in the graph above, the projection line (the dashed rad line with the arrow) from April 1 moves almost exactly through the points on April 10, April 24, May 24, and July 2. That line projects 3,500,000 cases on July 29. But look at what the actual case line (the orange line) does after July 2. It turns sharply upward, leaving the projection line in the dust and reaching the projected level a full 15 days earlier than projected! THIS IS BAD. The black projection line from July 2 to July 14 suggests the next milestone level of 5,500,000 cases by sometime beyond the current scope of my chart, likely around the end of August. When I devote some time to rescaling my chart, I’ll be able to post an exact projection date (recall that, when I started this, the virus was supposed to completely disappear by Easter, and we were supposed to have come through it with a number far, far lower than an astonishing 60,000 dead. I didn’t imagine that I would have had to plot a graph measured in months, let alone years).
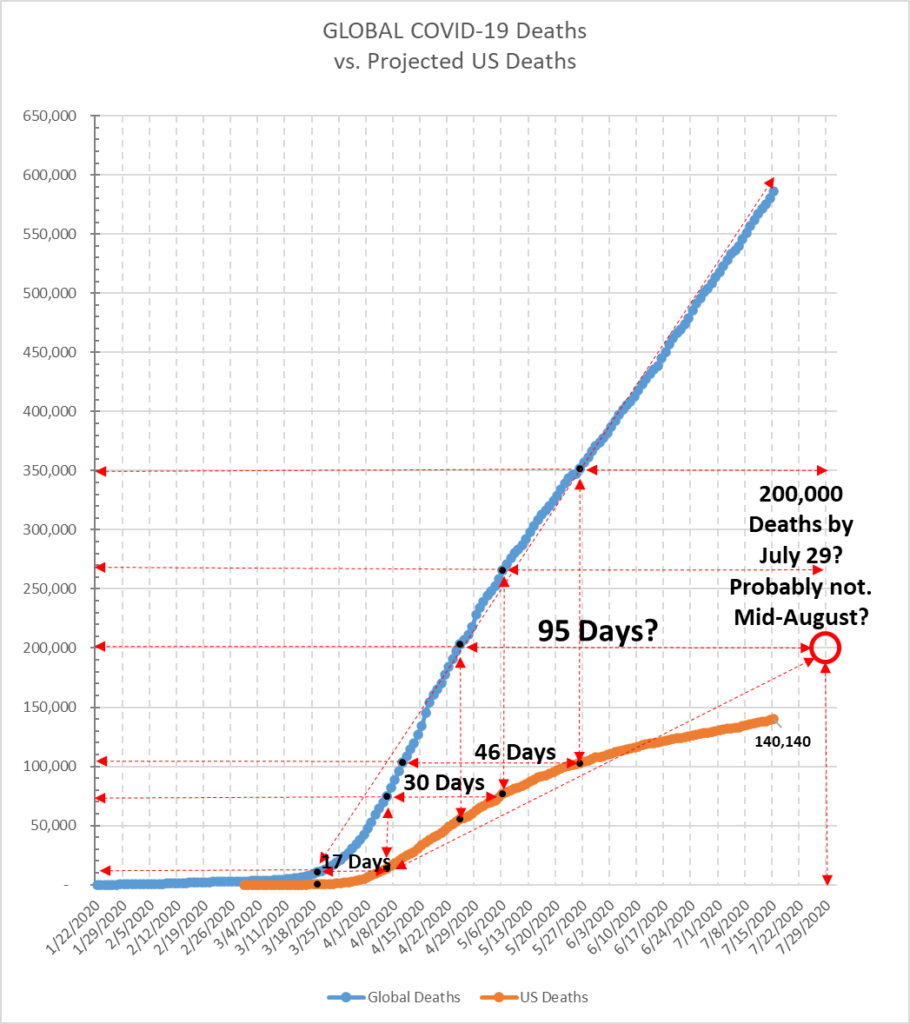
Meanwhile, the projection I made of the number of deaths has lagged the trendline I plotted. I explained in an earlier post about why I think I made this error, as it related to the number of new Cases and new Deaths per day we would be seeing. Please do go back through my archive posts to see where I was right and where I was wrong, and how I explained my findings.
As it happens, on April 23 I projected 100,000 deaths by May 13; I revised that to May 24, and I was off by two days: May 26. On that date, I projected 200,000 deaths by July 29, but I failed to consider the very same wave-form in the growth rates that should have told me that the growth in the absolute number of deaths would not be linear. Instead, I should have realized that the increase in deaths would taper for a period of time, and only when the trend in growth rates returned to an upward trajectory would we see the absolute numbers in total deaths return to the projection line.
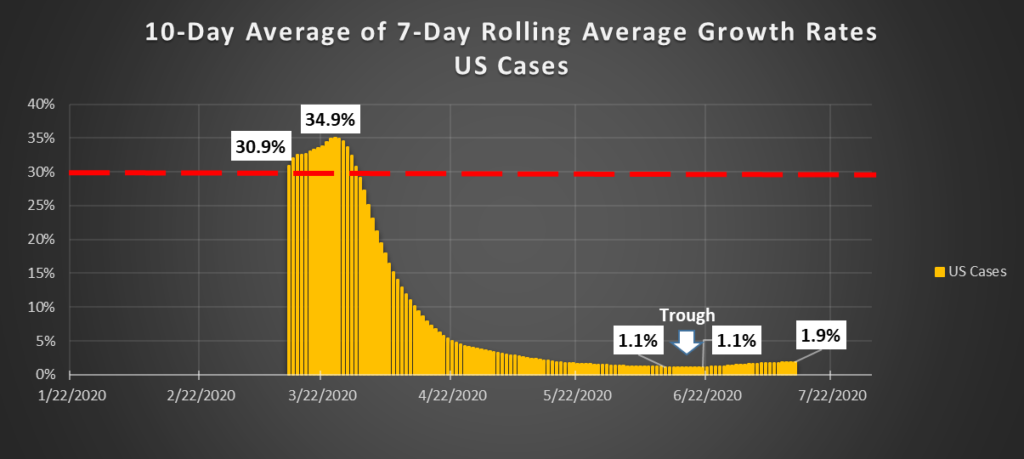
Here’s what really matters, though: the growth rate in cases is increasing. A trough formed at the level of 1.1 percent growth per day for the ten-day period of June 12 through June 21. As of today, the extended rolling average growth rate has climbed to 1.9 percent. Over a base of 3.5 million cases, one percent is 35,000, and 2 percent is 70,000. Cases. PER DAY.
This is what I have been writing about since mid-April.
The Case Fatality Rate (CFR) in the United States has fallen from a high point of 6.07 percent on May 14 to its current rate of 3.87 percent. That is: 140,140 total deaths ÷ 3,616,747 total cases = 0.0387. I expect that the increase in the number of cases will grow more steeply than the increase in deaths for some time yet, so this ratio may get smaller still. However, as the number of new cases tapers off, eventually, and those who are infected either recover or die, the number of deaths will grow more quickly (as a lagging indicator), and this ratio will rise again. Excluding the United States, the Global CFR is currently at 4.43 percent.
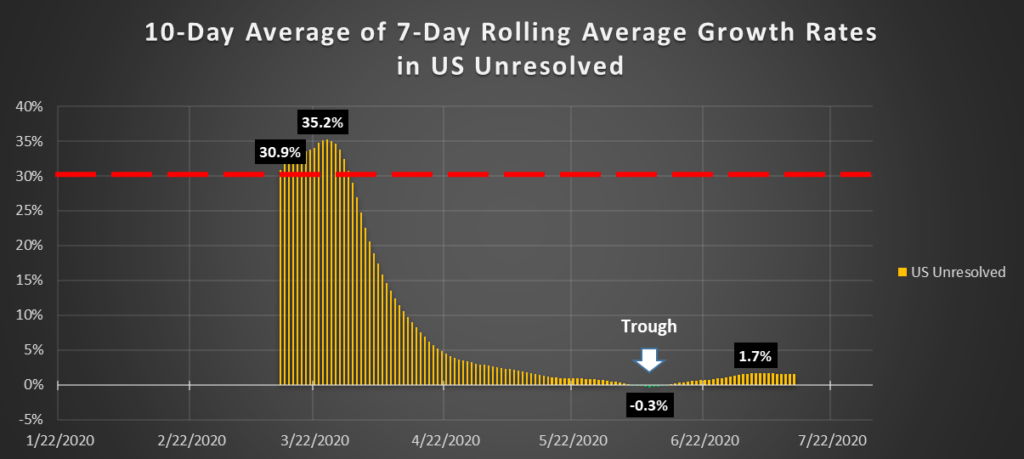
What matters a lot also is the number of active, or Unresolved, cases at any given time. This is what determines whether the hospitals will have a bed for you or not when you get sick. I went into lengthy explanation of this metric in an earlier post, so you can find it in the archives if you’re not clear on what this means or how it is derived. The growth rates in this measure declined steeply in March and early April, and then flattened in late April and throughout May. The trough formed at a barely negative level of -0.3 percent on June 9, and grew through July 4, when it reached positive 1.7 percent daily average growth.
The number of Unresolved cases is calculated by the following formula:
Total Cases – (Recoveries + Deaths) = Unresolved.
That formula currently looks like this:
3,616,747 – (1,645,962 + 140,140) = 1,830,645.
If we split the difference between the US CFR and the Rest-of-World CFR and call it four percent, then we can say with virtual certainty that, even if there were never to be a single new case of COVID-19 in the United States, with the current number of Unresolved cases at 1,830,645, the United States will see another 73,226 deaths.
So let’s put the children back into the schools.
