April 13, 2020, 11:45 pm
#stayhomebewell for past, current, and future analysis of the COVID19 pandemic. stayhomebewell.org. and www.facebook.com/stayhomebewell. Please react and share on any platform you use. It still matters what people do.
I can’t post in real time anymore. In the early days of this blog, I could post each night. Now, though, the amount of data is greater, and I’ve developed a lot more metrics, so each night’s analysis takes longer as I try to determine what to present each night. Therefore, tonight’s post is actually on last night’s data.
The data I’m presenting in this post is from 11:45 pm last night, April 13.
Tomorrow will be April 15, and that was the end date for many of my early predictions. For tomorrow’s post, I plan to resurrect those projections, from March 15, 18, 22, etc., etc., and hold them up against what actually happened. I hope you’ll check the page tomorrow for that.
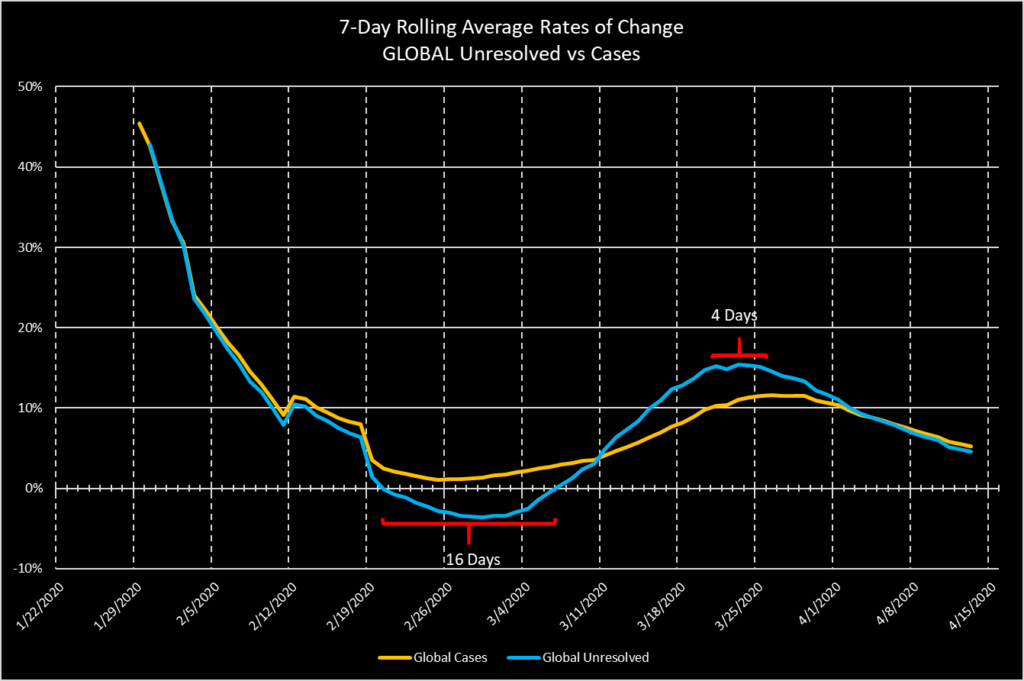
Global Cases: up 3.9 percent, or 72,025, to 1,925,180. The growth rate continues to decrease. If you’ve been reading this blog, you’ll know not to be deceived by this. I believe this just represents the lull in between the first devastating wave and the second wave, which is gathering as we speak.
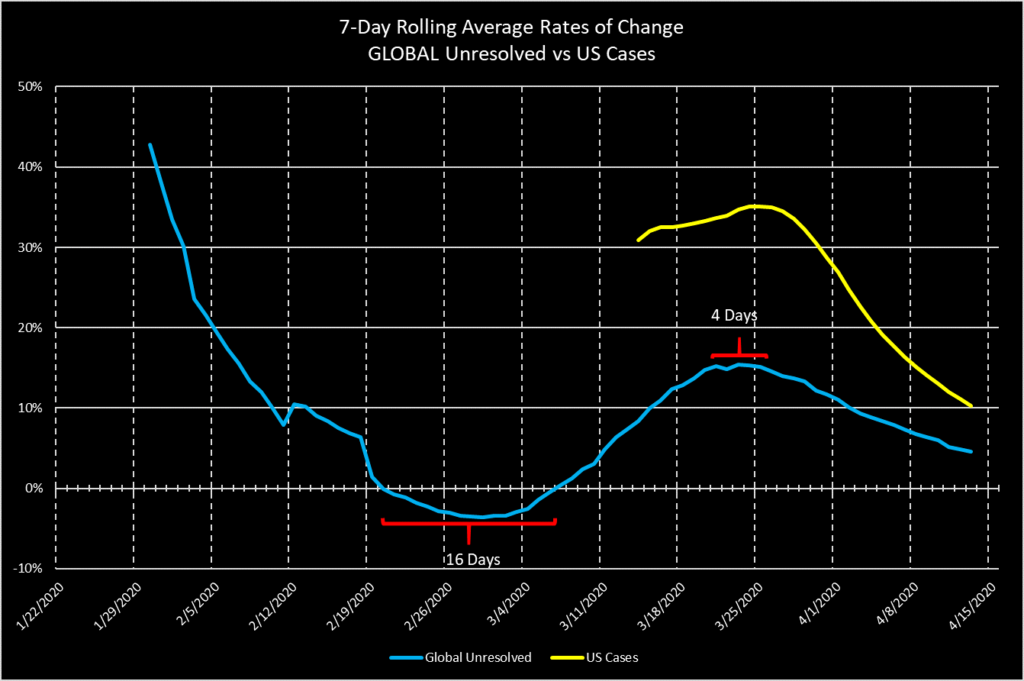
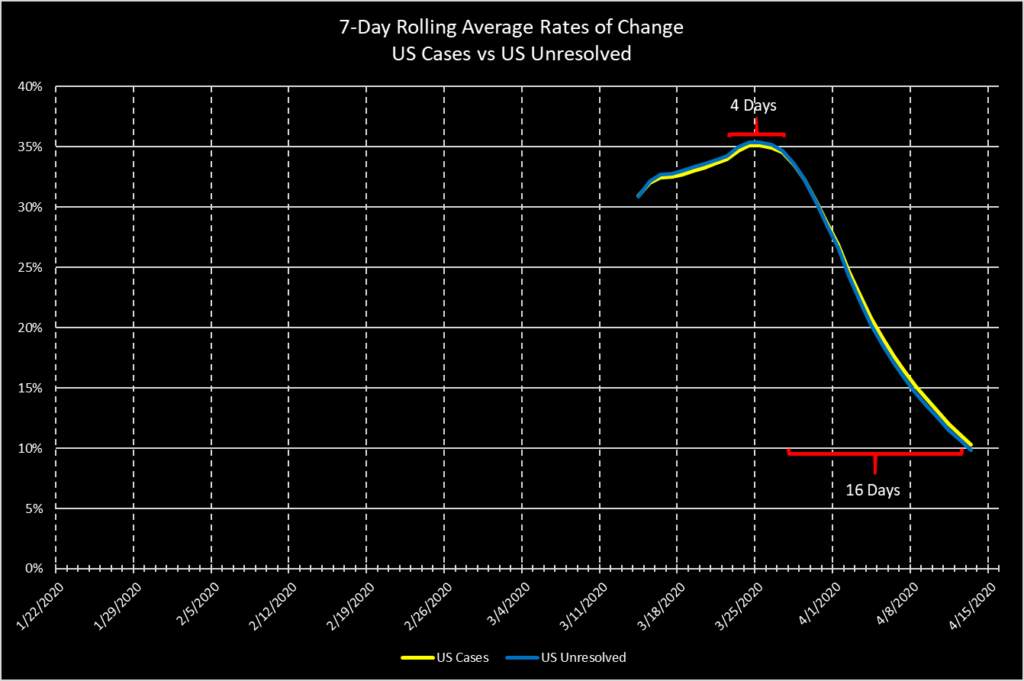
US Cases: up 4.8 percent, or 26,725, to 587,150. The growth rate continues to decrease.
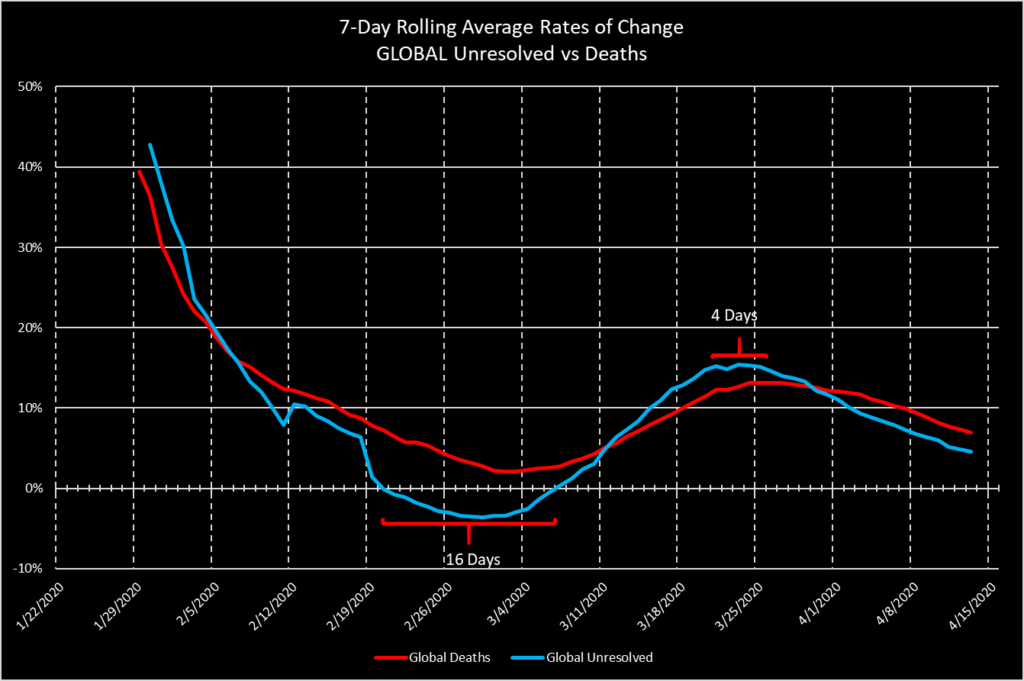
Global Deaths: up 4.8 percent, or 5,450, to 119,700. The growth rate continues to decrease.
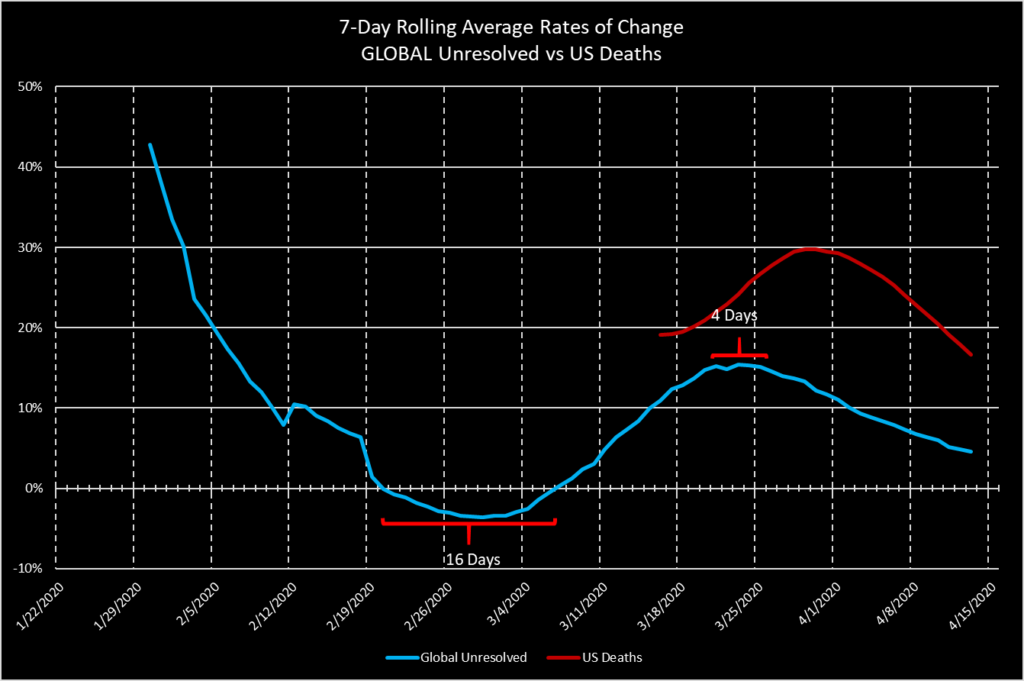
US Deaths: up 6.9 percent, or 1,530, to 23,645. The growth rate continues to decrease.
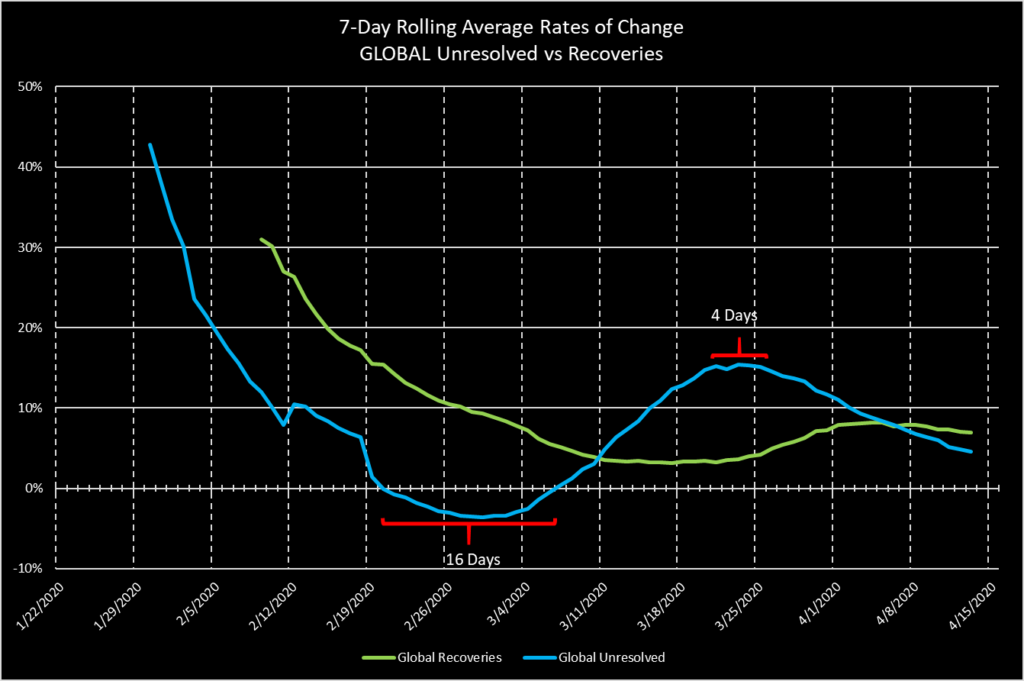
Global Recoveries: up 5 percent, or 21,400, to 445,025. The growth rate is similar to that from yesterday.
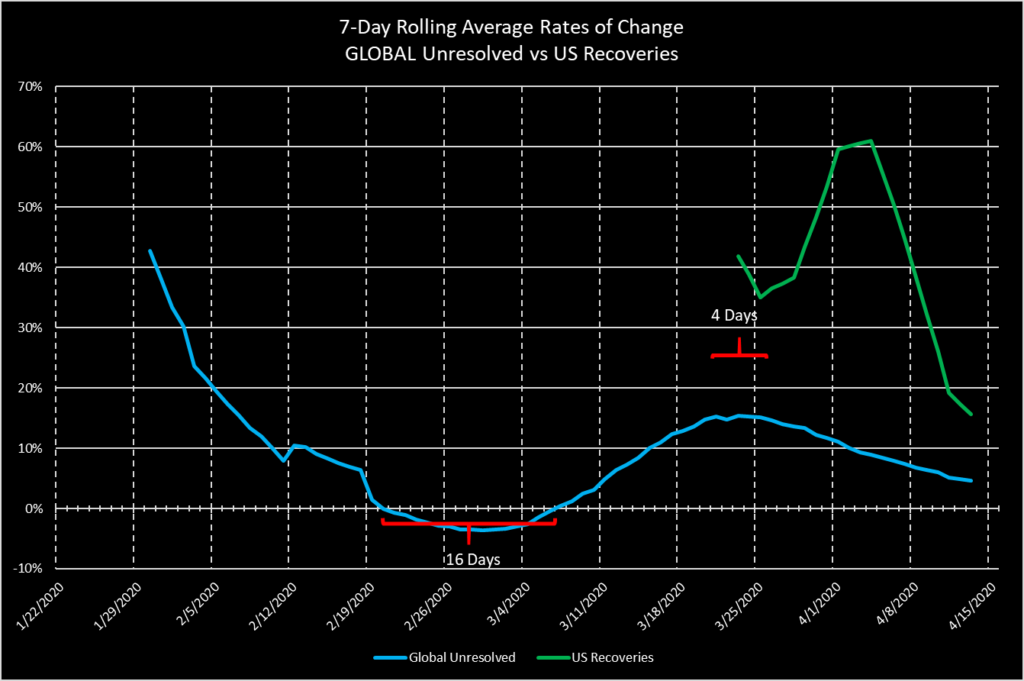
US Recoveries: up 13.2 percent, or 4,315, to 36,950. There have been wide fluctuations in this growth rate over the last nine days. The extended rolling average is 15.6 percent, which has been decreasing from a rate of 61 percent on April 4.
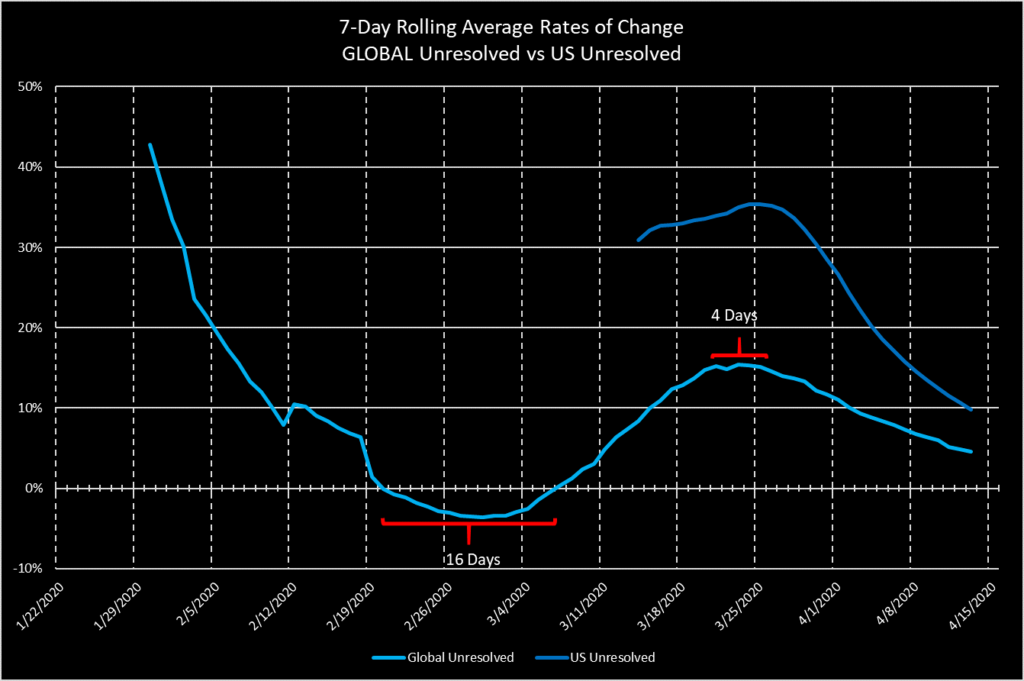
Global Unresolved: up 3.4 percent, or 45,175, to 1,360,450. The extended rolling average is 4.6 percent, down from the last peak of 15 percent that held from March 21 to March 25.
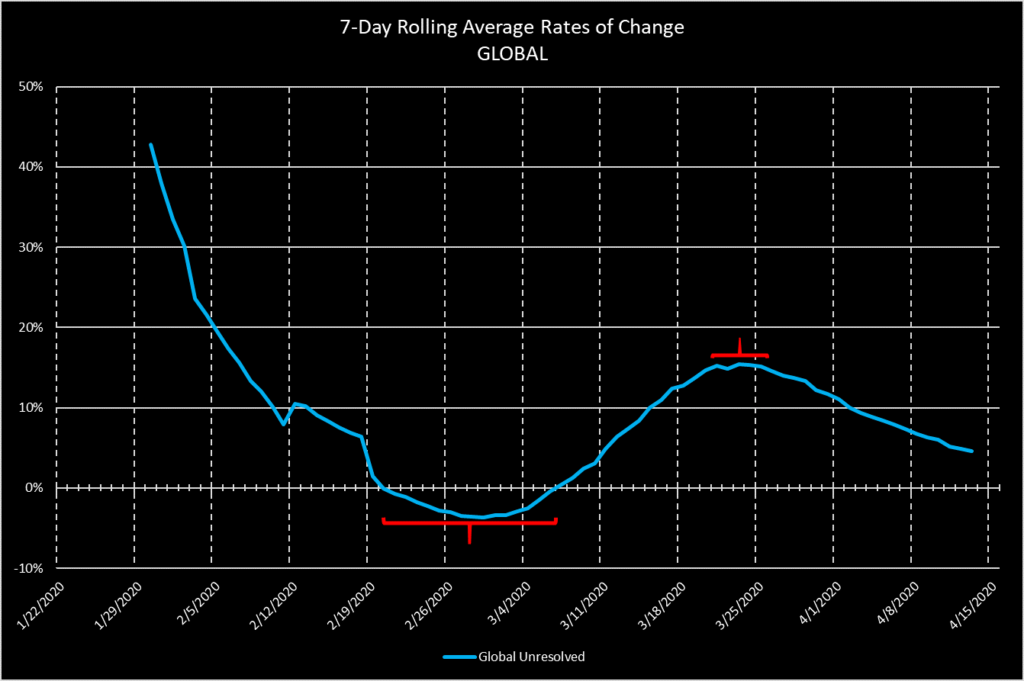
You can see that the number of Unresolved cases (active illnesses) actually decreased globally between February 20 and March 7. I believe this is the graphical representation of the virus’ course through China. The growth rate returning to positive values on March 8 represents the shift in the epicenter to Italy, and the peak plateau at 15 percent from March 21 to 25 represents the darkest days in Italy.
I predict that the curve will bottom again at a level above zero, representing the shift in epicenter from Europe to New York, but I don’t expect the growth rate to drop below zero again, reflecting a net decrease in the number of Unresolved cases globally, because the increasing additional new cases throughout the rest of the United States will come closer on the heels of the New York epicenter than New York did on the heels of Europe. The time lags between waves will grow shorter and shorter than was the original lag between China and all subsequent waves.
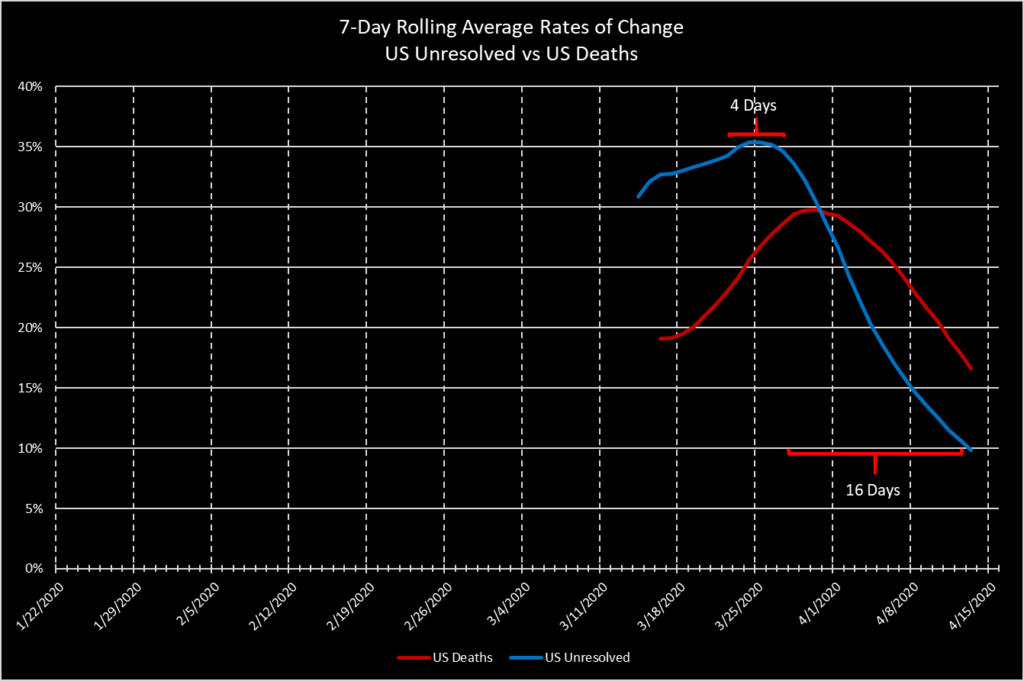
US Unresolved: up 4.1 percent, or 20,880, to 526,565 current COVID-19 illnesses documented in the United States. The 4.1 percent growth rate is the lowest since it peaked at 35.4 percent on March 25.
The next series of charts will show various juxtapositions between Global and US Cases, Deaths, Recoveries, and Unresolved.
*Methodological Note: Each point on the Global chart curves represents a 7-day rolling average ending on the date of the data point. The US data, however, shows the 10-day average of 7-day rolling averages ending on the date of the data point. The day-to-day volatility of the US data has been such that even plotting 7-day rolling averages produces curves that are highly jagged and messy to look at. For that reason, for ease of comparison I have juxtaposed apples and not quite oranges, but 7-day apples and “10-days-of-7-days” apples. The upshot of this is that the careful reader will notice that the US data sets begin ten days later than the actual records of Cases, Recoveries, and Deaths, as it takes 16 days to be able to produce the first 10-day average of 7-day averages. The period of negative growth in Global Unresolved is also sixteen days. This seems like to great a coincidence to be a coincidence, but I think that it is.
