January 10, 2021
#stayhomebewell
It has been just over a month since my last update, and I’m writing because it seems that the Titanic has shifted again.
Before I explain what has changed, I’ll spend a little time just giving a status update.
U.S. Daily New Cases: Over the last 30 days, the daily average number of new cases has been just over 220,000. Over the last 14 days, that average has been over 230,000. And over the last 7 days, the average has been over 260,000. The most recent 7-day number of cases is 18 percent higher than the 30-day average.
U.S. Daily Deaths: The corresponding numbers for average daily deaths in the United States have been 2,725 over 30 days, 2,970 over 14 days, and 3,250 over 7 days. The most recent 7-day number of cases is 19 percent higher than the 30-day average.
U.S. Daily Recoveries: The average daily numbers of recoveries have been 135,000, 142,000, and 144,000, over 30 days, 14 days, and 7 days, respectively. Thus, the most recent 7-day number of recoveries is only 7 percent higher than the 30-day average.
This does not bode well. It means that things are getting worse faster than they are getting better.
If you’ve read my blog before, then you know that the most important predictive metric is that of the unresolved cases, or (total cases – deaths + recoveries).
U.S. Daily Unresolved: The average increase in the daily number of unresolved cases over the last 30 days has been 84,000; over the last 14 days it has been 88,000, and over the last 7 days it has been 102,000. The most recent 7-day number of unresolved cases added to the ranks of the infected in the United States is 21 percent higher than the 30-day average.
This means that the strain on the U.S. hospital system is increasing.
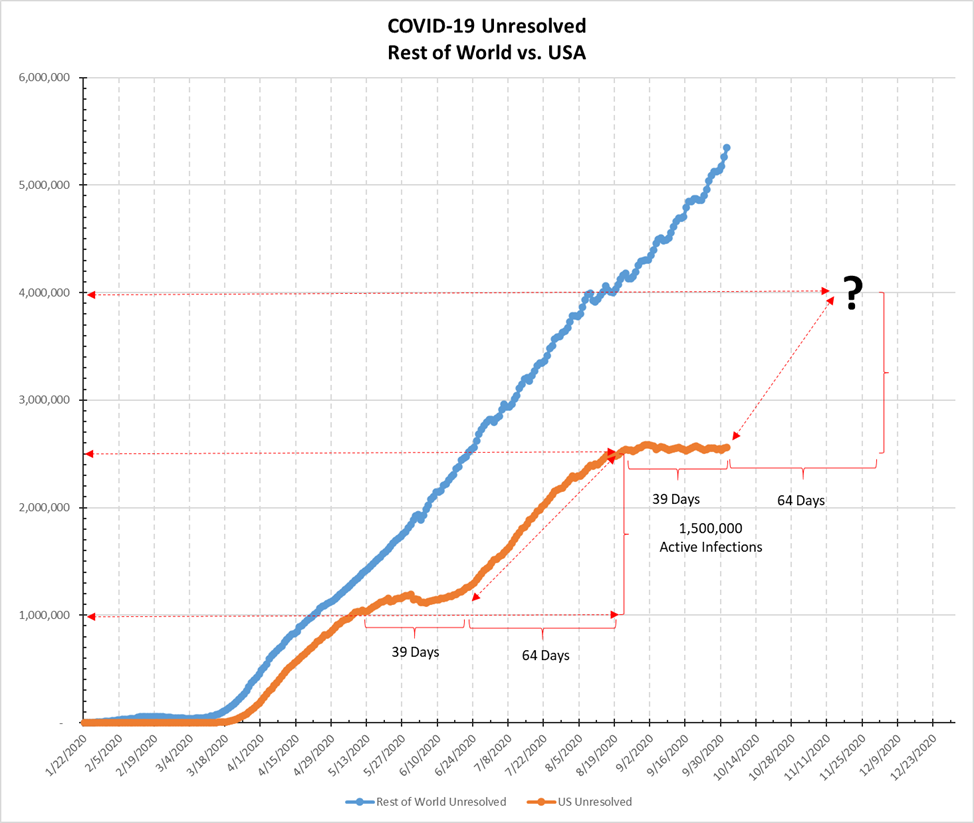
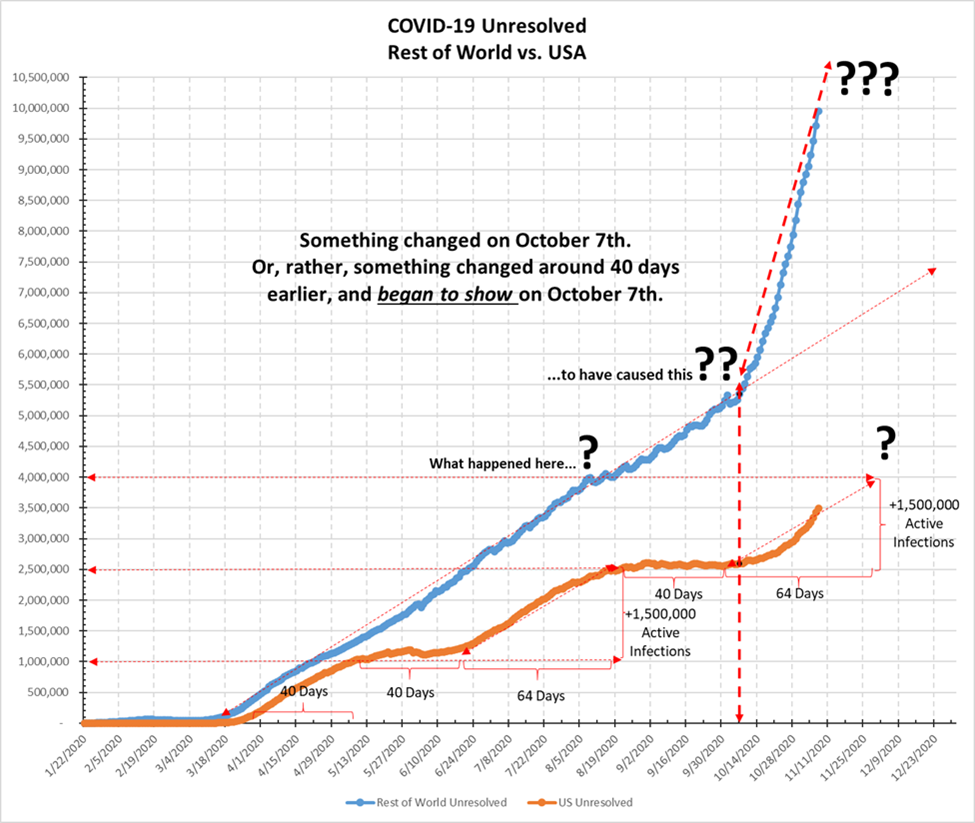
Unfortunately, over the summer, everyone just became exhausted with the situation. There was a period of about six weeks, from mid-August to early October, during which the number of unresolved cases in the United States held steady at a level of around 2,500,000 cases. As I mentioned in my post of November 8 (https://stayhomebewell.org/2020-11-08/), something changed on October 7. Rather, I pointed out that something must have changed roughly 40 days prior to October 7, such that the change became visible on that date. What happened was that the rate of growth in unresolved cases worldwide, which had been decreasing for the five months from March to August, bottomed out at just above zero percent. After that, it returned to increasing growth, which was manifested forty days later.
Here’s what I posted on October 24:
And here’s what that looked like on November 8:
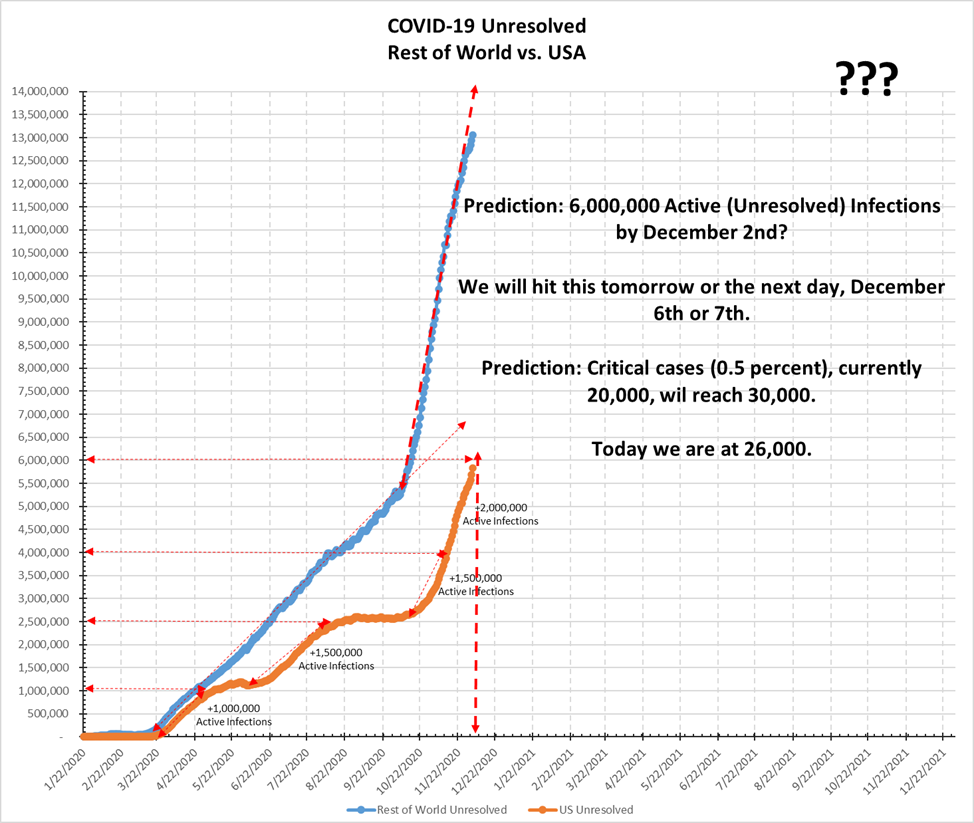
Here’s what I posted on December 5 (https://stayhomebewell.org/2020-12-05/):
And here’s where we are today:
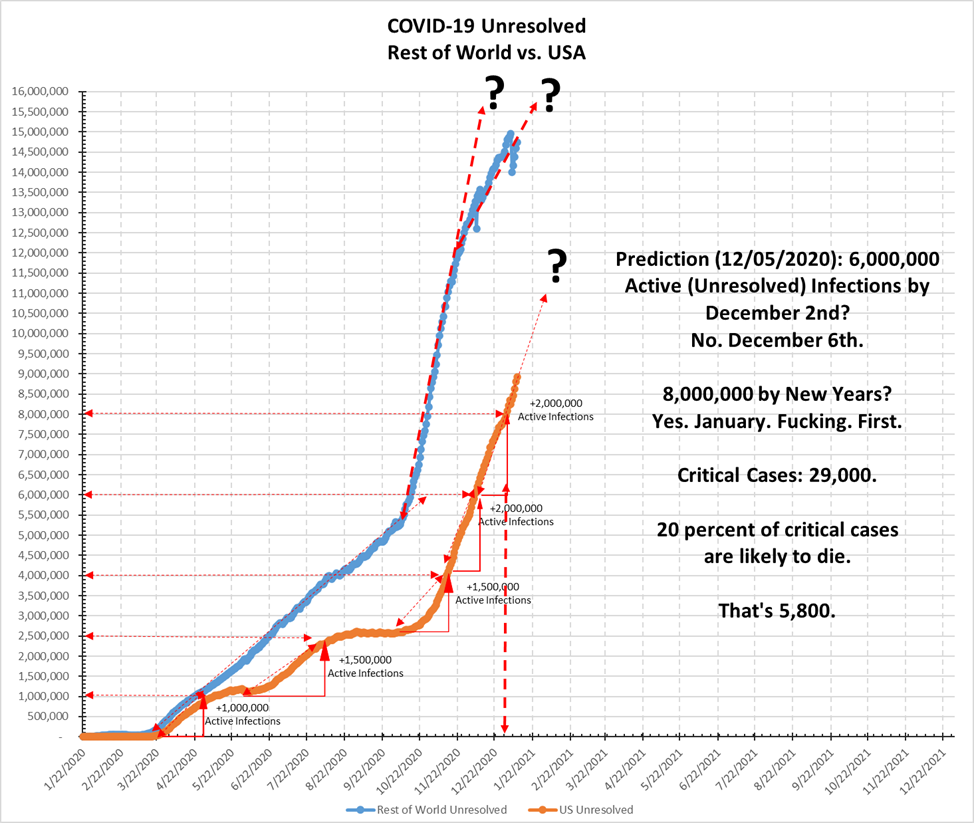
Now, if you are an astute reader, you will have noticed that something has happened to the trajectory of the blue line, showing that the rate of increase in the number of unresolved cases in the rest of the world is slowing. Whereas, from October 7 until approximately November 24, the unresolved cases were following a nearly vertical straight line, since November 24, the curve is flattening.
I have no idea what caused it, but we can see it represented in the chart of the extended rolling average growth rate:
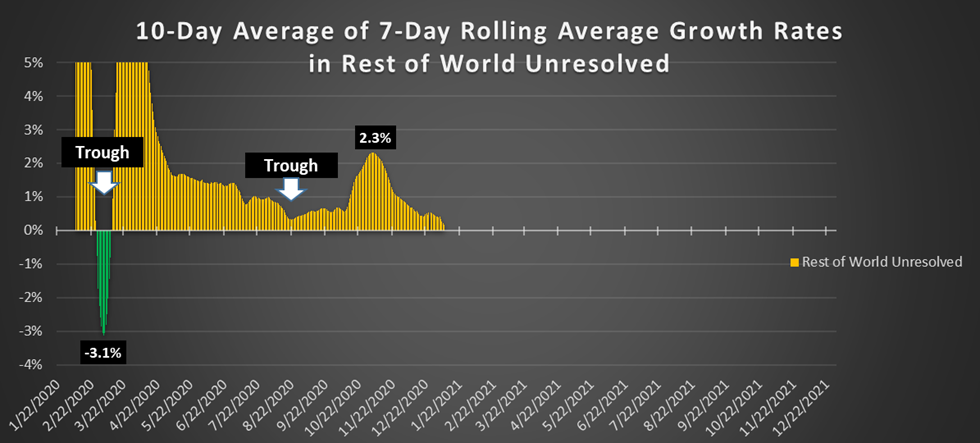
The rest-of-world growth rate peaked on November 7 and fell below one percent on November 24th. This suggests that the rest of the world has passed through its third wave. When the fourth one will arise, I don’t know.
However, it should be instructive to look at the corresponding chart for the growth rate of unresolved cases in the United States:
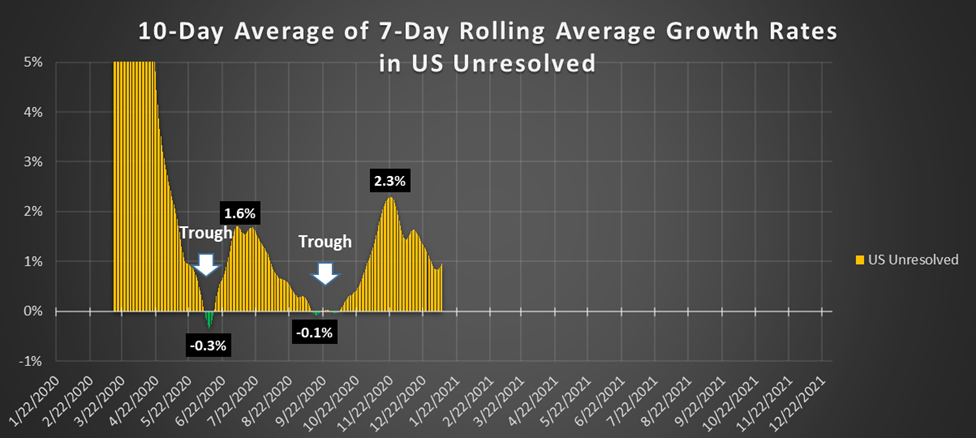
I can’t help but notice that the peak in the growth rates of the third waves both in the rest of the world and in the United States was exactly 2.3 percent. The U.S. hit this peak on November 22, fifteen days later than the rest of the world. On the downward slope of this third mountain we see two upward “head fakes.” I have no idea what will happen, but I can’t help but be concerned that Thanksgiving plus 40 days = January 5. On November 26, we had 158,000 new cases, and on January 5, we had 244,000. That’s an increase of more than 54 percent.
Then we had Christmas. On December 25, we had 162,000 new cases. Christmas plus 40 days is February 3. An increase of 50 percent would put us at 250,000 new cases. Daily.
Then we had New Years. On January 1, we had 166,000. New Years plus 40 days is February 10. Then we had the insurrection on January 6, where several thousand people from all over the country were in extended close proximity, shouting and maskless. Insurrection plus 40 days is February 15. And we have the MLK holiday and the Inauguration coming up.
Here’s an overview that shows the timeline in the number of cases and deaths in the United States:
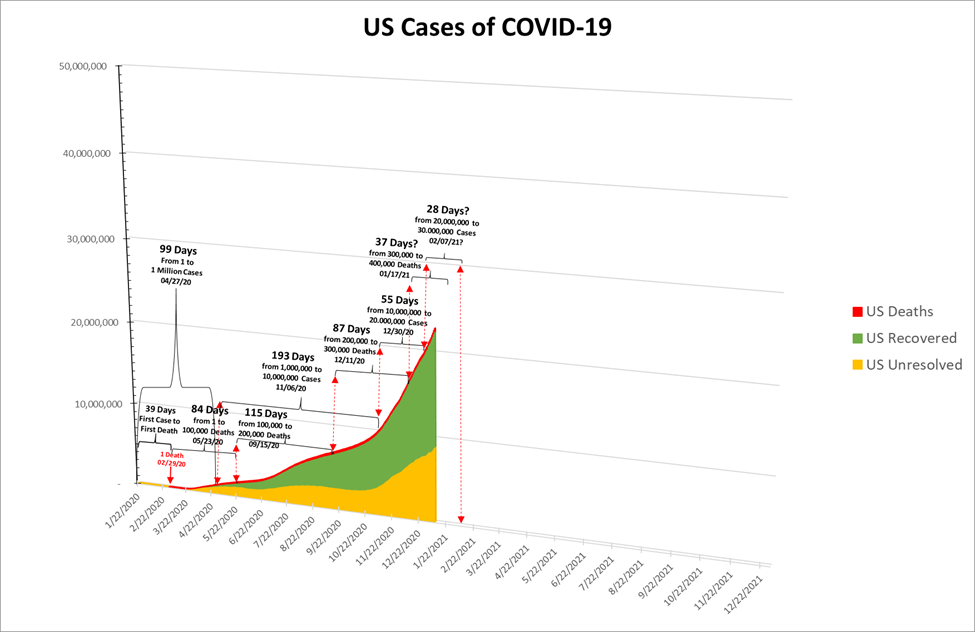
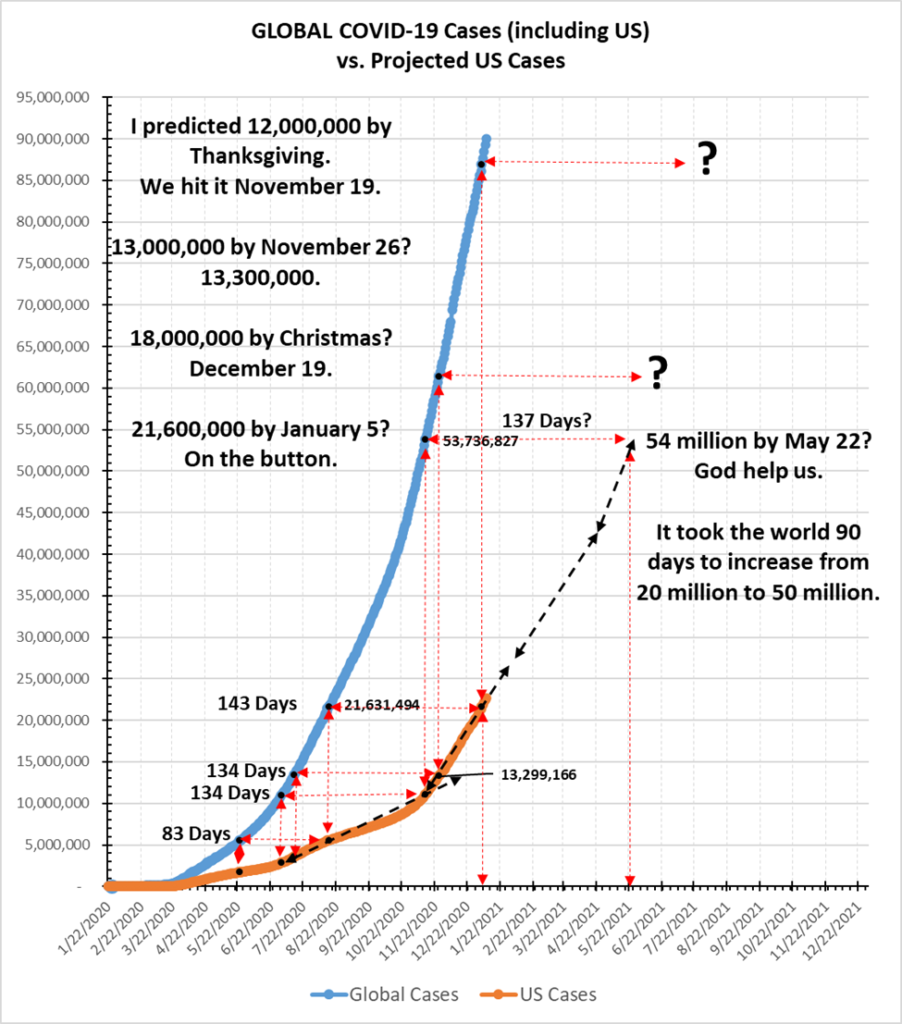
It should be deeply troubling to observe that it took 99 days to go from one (reported) case to one million cases, but only 193 days to go from one million to ten million cases. It then took only 55 days to go from ten million to twenty million cases, and by my projection, it will have taken only 28 days, by February 7, to have gone from twenty million to thirty million cases.
292 days from zero to 10 million; (rest-of-world took 176 days)
55 days from 10 million to 20 million; (rest-of-world took 51 days)
28 days from 20 million to 30 million. (rest-of-world took 40 days)
God help us, but this pattern suggests it is accelerating.
Rest-of-world went from 30 million to 40 million in 27 days;
Rest-of-world went from 40 million to 50 million in 25 days;
Rest-of-world went from 50 million to 60 million in 23 days.
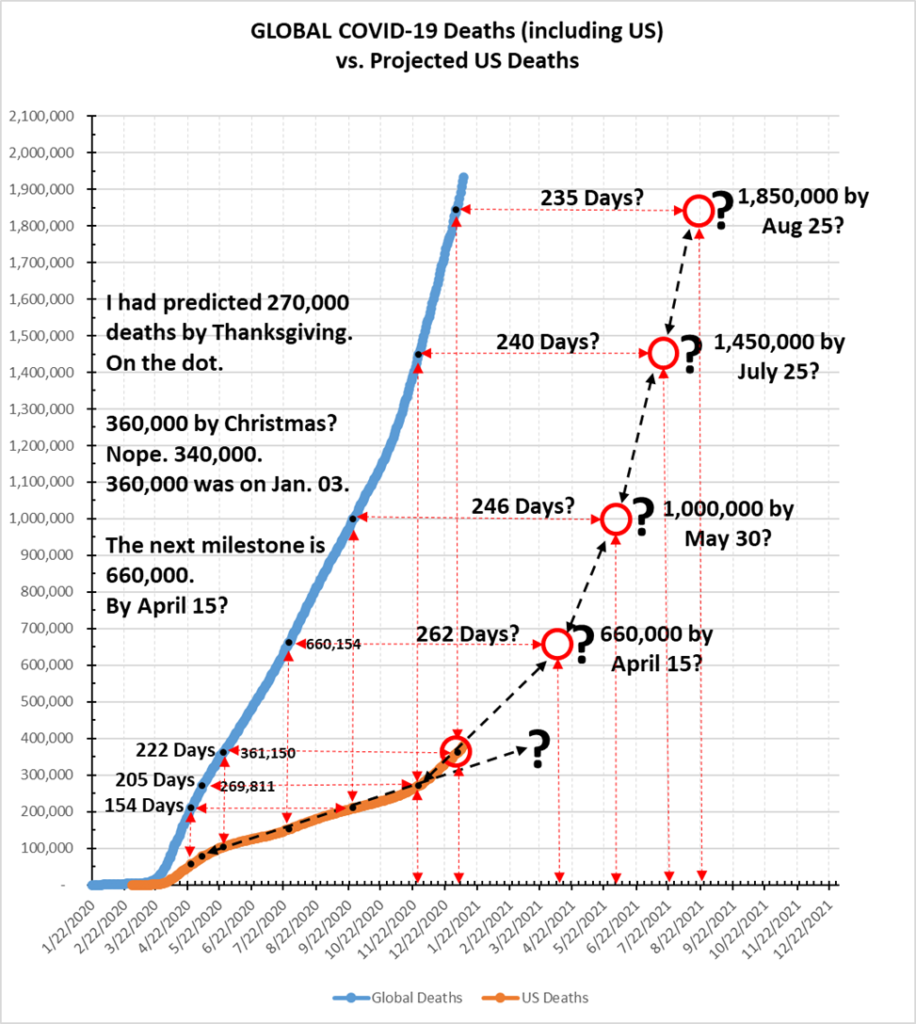
And right alongside those figures, starting from (you guessed it) 40 (well, actually 39) days later, it took 84 days to go from one death to one hundred thousand deaths; 115 days for another hundred thousand; only 87 days for the third hundred thousand; and at the current rate, it will take only 37 days for the fourth hundred thousand deaths.
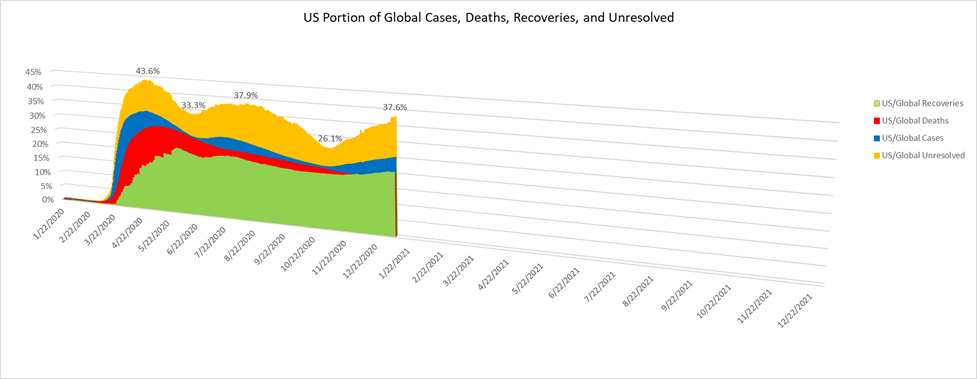
And here is a chart showing the United States as a portion of global cases, deaths, recoveries, and unresolved cases. The takeaway is that, since November 6, 2020, the United States has accounted for an increasing proportion of the world’s unresolved cases. That is, we are doing worse and worse in comparison to the rest of the world:
If things don’t change, the following charts show what I fear may be in store for the United States:
Please let me be wrong about everything.
