stayhomebewell for past and future updates.
Please share with your friends and perhaps we might save a life or two. Million.
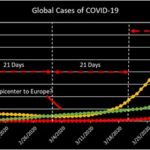
Global Cases: up 9.15 percent, or 78,375 new documented infections today, to 935,300.It is worth continually noting that the first documented case of COVID-19 infection was on December 31, 2019. That was exactly 93 days ago. Discarding all ebbs and flows in the daily changes, this increase from 1 to 935,300 means that the average daily growth rate has been just over 16 percent.When it comes to growth rates, it can be misleading to look just at today’s rate and compare it to yesterday’s. I might be collecting numbers at different times of the day, or reporting entities might be gathering and reporting data unevenly from one day to the next.
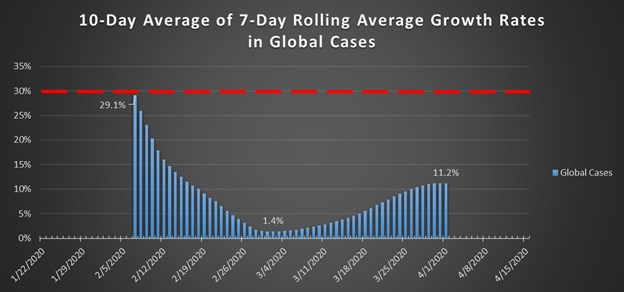
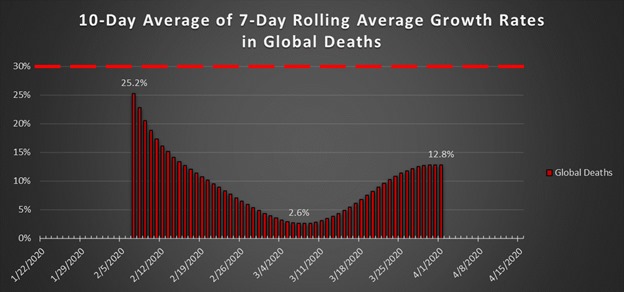
For that reason, each day I have been looking at the average growth rate over the past seven days. But if we have one anomalous piece of data in that sample, it might skew that average up or down, for the seven days that one anomaly is included in that average.So, what I’ve done now is calculate the 7-day rolling average each day for the preceding 7-day period ending on that day, and then take the average of those averages, over a ten-day period. I think that this gives the most reliable reading of the actual trend we’re trying to observe, while we are in the middle of it.Thus, the average of the last ten 7-day rolling average growth rates in Global Cases, is 11.0 percent, and has been trending upward since its low point of 1.4 on March 2, 2020.
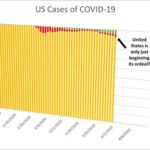
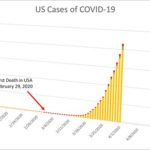
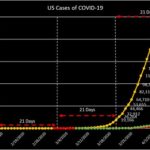
US Cases: up 14.75 percent, or 27,650 new documented infections today, to 215,000. It is worth continually reiterating that the first recorded case in the United States was on January 22, 2020, which was exactly 70 days ago. Ten weeks from 1 to 27,650. This produces an average growth rate of 15.7 percent. This suggests that the spread of COVID-19 in the United States is following virtually the exact same trajectory as that of the world as a whole.The global data includes 92 days’ worth of data points. The United States’ data includes 70 days’ worth of data points.This would appear to strongly suggest that over the next twenty-two days, the United States can expect to suffer the exact same number of deaths: 935,300 – 215,000 = 720,300 cases.
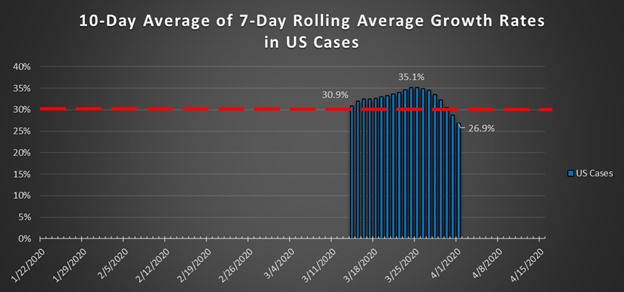
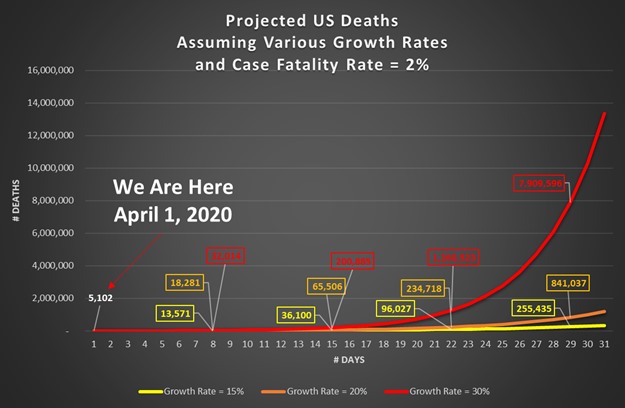
A growth rate of 30 percent indicates a doubling rate of between two and three days.If the case fatality rate remains at 2.7 percent (the average CFR over the last 33 days’ worth of data in the US), then the united states can expect to suffer 14,406 deaths over the next three weeks, meaning 20,000 deaths by April 22.On March 15, at 4:00 pm, the United States had 3, 400 cases. I tracked back 53 days to when the Global number of cases had been at that level, and projected that if the United States’ curve followed essentially the same slope as that of the Global number (essentially, just China at that time), we could expect to see 60,000 cases and 1,600 dead by April 1. These projections were one week too conservative, as we reached those levels on March 25 and March 27, respectively. On March 16, I began adding a single dot on each graph to track how closely my projection tracked with the emerging reality.On March 18, I sent out my appeal to my friends to disseminate as widely as possible my essay about Pascal’s Wager and the Prisoners’ Dilemma. My projection remained naively based on the assumption that the US trajectory would match that of the rest of the world.On March 21, I revised my projection to reach a little further into the future, and predicted 80,000 cases and 4,000 deaths by April 15. How naïve I was.
By March 23, it was clear that the virus was spreading much more quickly in the US than what the numbers for China and the globe showed.On March 27, I revised my projection up to 200,000 cases and 11,000 deaths by April 15. That seems quaint now.
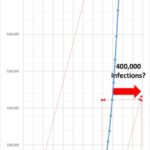
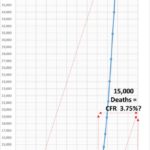
So on March 30, I revised my projection up again, to 400,000 cases and 15,000 deaths by April 15. Again, it appears that the United States will reach those levels several days before that time, perhaps faster by a week. I think that perhaps the error I made was in starting my baseline slope against the global data too far back in its history, thereby including too much of the flat part of the line in my projection. The United States was at the very tail end of its flat section of the slope, and moved immediately into the exponential growth portion of its curve. If I had angled my base projection line more steeply, basing it on the point in the Global curve where it really began to take off, then my future projection line would have been much steeper. Hell, I was horrified at what I was looking at as it was. It now appears very likely that, again, I was not prepared for the reality we are about to enter.
Global Deaths: up 12.1 percent, or 5,085, to 47,200. Nearly one-quarter of those deaths occurred in the United States.
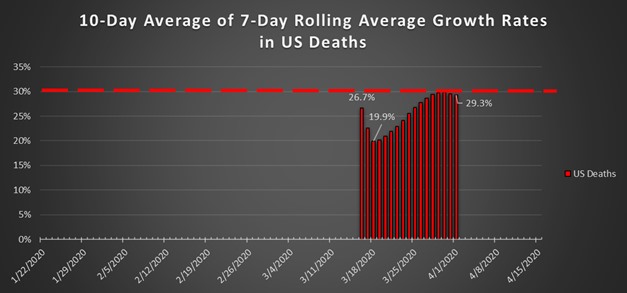
US Deaths: up 32.2 percent, or 1,242 deaths today, to 5,102. Nearly one quarter of all deaths in the United States occurred today. Yesterday’s death toll was 695, which was the highest to date. Today’s toll nearly doubled that.
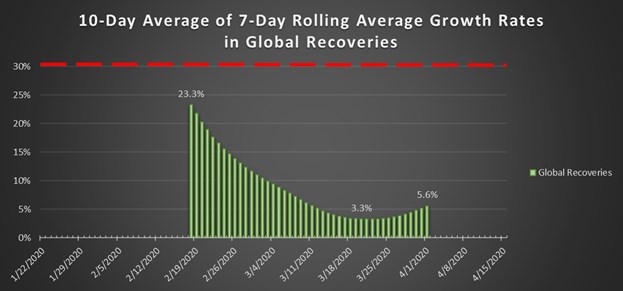
Global Recoveries: up 9.5 percent, or 16,860, to 194,000 people worldwide who have been documented as having contracted COVID-19 and recovered.
Global Recoveries: up 9.5 percent, or 16,860, to 194,000 people worldwide who have been documented as having contracted COVID-19 and recovered.
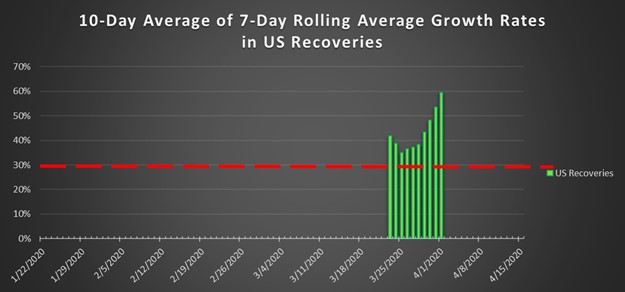
US Recoveries: up 37.4 percent, or 2,415, to 8,880. More than one quarter of all US recoveries to date were recorded today. So far, the 10-day average of the 7-day rolling averages in the growth rates of recoveries have been consistently above 30 percent. This is a hopeful indicator, but I would note that we have only ten data points to work with so far.
