May 1, 2020, 11:00 pm
#stayhomebewell for past, current, and future analysis of the COVID-19 pandemic. www.stayhomebewell.org. and www.facebook.com/stayhomebewell. Instagram and Twitter, too. Please react and share on any platform you use. It still matters what people do.
Global Cases: up 2.82 percent, or 93,343, to 3,401,002. This is the fourth day of increasing growth rates, from the low point of 2.24 percent on April 27. In terms of absolute numbers, new Cases (rounded) totaled 67,100 on that date, and rose to 76,000, 82,000, 87,500, and 93,343 today. The extended rolling average has not bottomed yet, but it is approaching today’s growth rate, at 3.1 percent.
US Cases: up 3.33 percent, or 36,429, to 1,131,452. The low point in the growth rate in the United States was also on April 27, at 2.31 percent. The rate has grown in each of the four days since. In absolute terms, the (rounded) numbers were 25,640, 28,770, 30,500, and 36,429 today. The extended rolling average has not bottomed yet, but it is approaching today’s growth rate, at 3.6 percent. Some models of the data in the news today are showing that the United States has passed its peak and that new cases are on the decline. I don’t know how these models were made, and I assume they are using the same underlying data as I am, but my interpretation of the data seems to differ substantially.
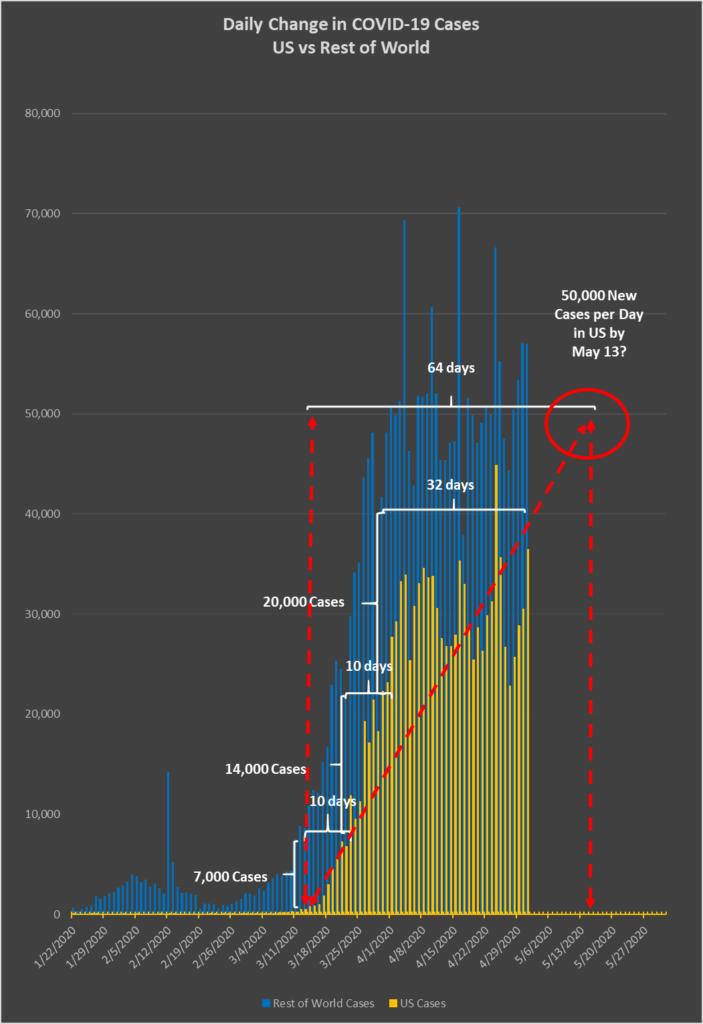
I find the chart below to be very frightening. However, I have found all of my projections since March 15 to be very frightening and, unfortunately, so far, they have all proved accurate, despite my sincere wish to be wrong.
In the chart below, I have juxtaposed the daily number of new Cases in the United States with the same metric in the Rest of the World. (Previously, I had always calculated only the US and Global figures, which included the US; as of today, I have separated the US and the Rest of World, since the US is very near to accounting for fully one-third of all Cases globally and rising, which renders comparisons less meaningful).
When the pandemic in the United States was only just beginning, on March 11, the daily number of new Cases was only 200, but the number of new Cases in the Rest of the World on that day was 7,400. It took 10 days for the US to reach the level of 7,000 new Cases, on March 21. And on March 21, the Rest of World was adding 24,000 new Cases per day. It was another 10 days, March 31, before the US had reached that level of new Cases each day. And on March 31, the Rest of World was adding 40,000 new Cases per day. Thirty-two days later, on May 1, the US is adding 36,000 new Cases per day, and the Rest of World is adding 57,000.
Here’s the rub: Over the 36 days from March 23, however, the daily growth rate in new US Cases had been decreasing, from a high of 35 percent to the low point of 2.31 percent on April 27. For the last four days, that growth rate has been increasing, and I expect that it will continue to increase for another 30 days. Therefore, I am projecting that the number of new Cases in the United States each day will reach a level of 50,000 by May 13.
All of this has to be viewed against the backdrop of state after US state declaring that they have either already removed all official stay-at-home orders, or that those orders will expire soon.
As ever, I desperately hope that I am wrong about everything. We’ll know in under two weeks.
That’s all for today.

