April 25, 2020, 10:20 pm
#stayhomebewell for past, current, and future analysis of the COVID-19 pandemic. www.stayhomebewell.org. and www.facebook.com/stayhomebewell. Instagram and Twitter, too. Please react and share on any platform you use. It still matters what people do.
Global Cases: up 3.21 percent, or 90,825, to 2,920,875. While yesterday’s increase of 111,000 cases was anomalous and I don’t know the reason for it, today’s increase was the fourth day from a low point of 3.03 percent on April 21. I believe it is now safe to call the trough, but the extended rolling average is still declining (as it includes the higher rates from as far back as 17 days ago).
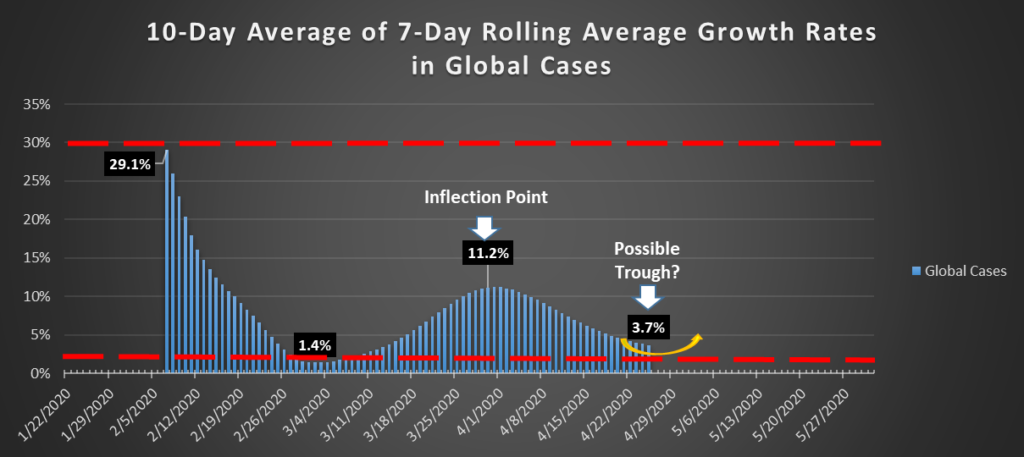
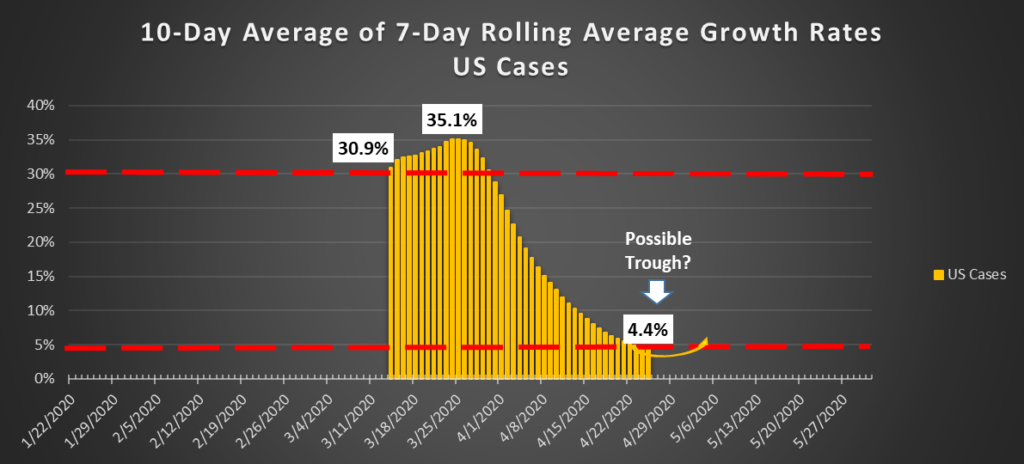
US Cases: up 3.85 percent, or 35,615, to 960,650. Yesterday’s increase of nearly 45,000 cases was an anomaly, but the trough appears to have formed between April 19, with a growth rate of 3.4 percent, and April 21, with a rate of 3.3 percent. Daily growth rates have climbed each day since then. The extended rolling average growth rate continues to mark new lows each day, and has not yet bottomed, for the same reason as described above.
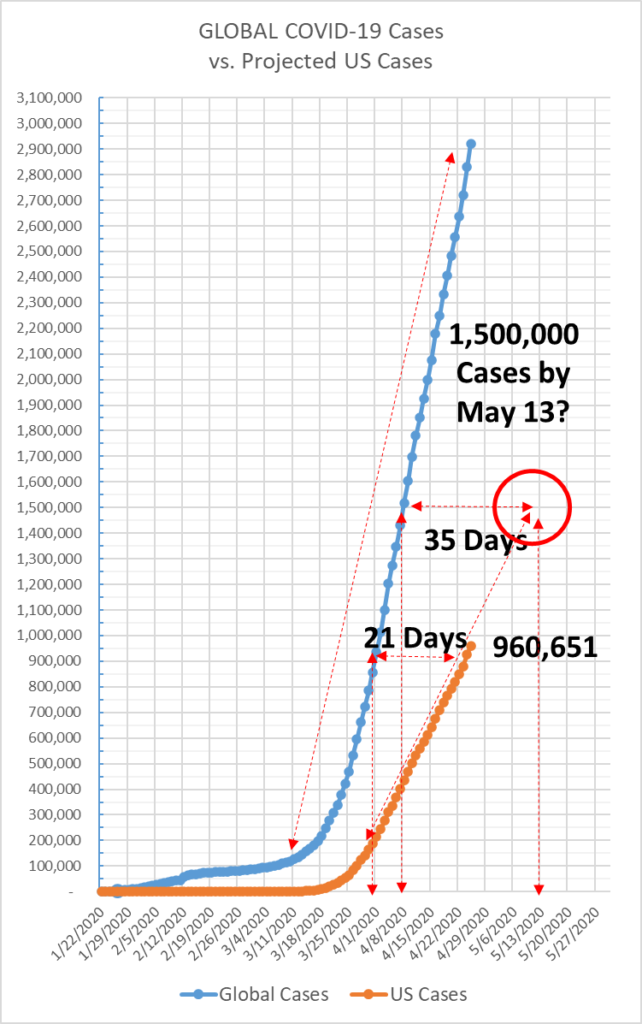
I projected 750,000 US Cases on April 15, but I was off by four days, as we reached that point on April 19. On April 23, when the US was at 880,000, I projected 1,500,000 Cases by May 13, and I will be posting the following chart with each update, so you can see for yourself how reality develops.
Again, I don’t claim to have any special understanding of this pandemic. But the graphs speak for themselves. From zero percent on January 22, the US now accounts for 32.9 percent of Global Cases.
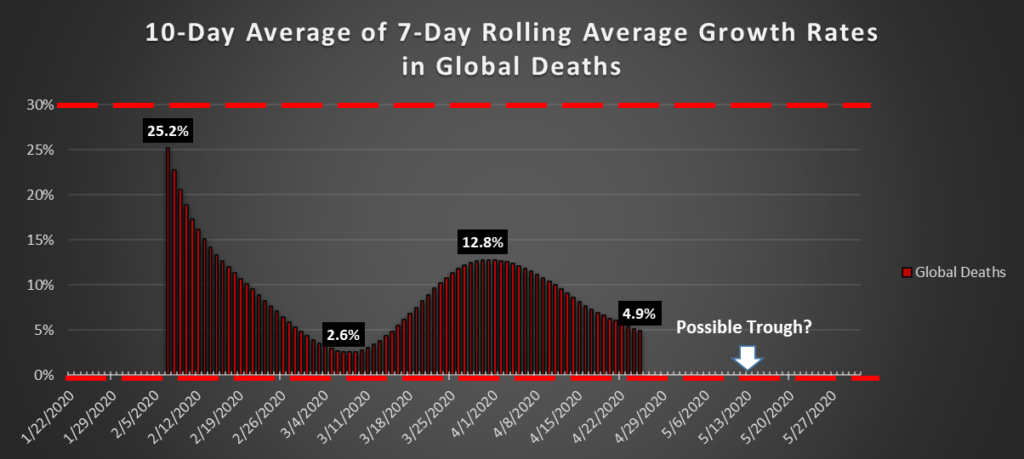
Global Deaths: up 3.06 percent, or 6,025, to 203,272. The low point in the growth rate occurred on April 19, when it stood at 2.64 percent. However, since that time, it has not increased each day. Rather, it has fluctuated between today’s 3.06 percent and the 4.22 percent of April 21. The extended rolling average growth rate is, however, at a low point of 4.9 percent. Whereas I had projected a trough forming around May 13, it appears that, as with so many other things in this pandemic, it may be happening earlier than I thought.
US Deaths: up 3.97 percent, or 2,071, to 54,256.
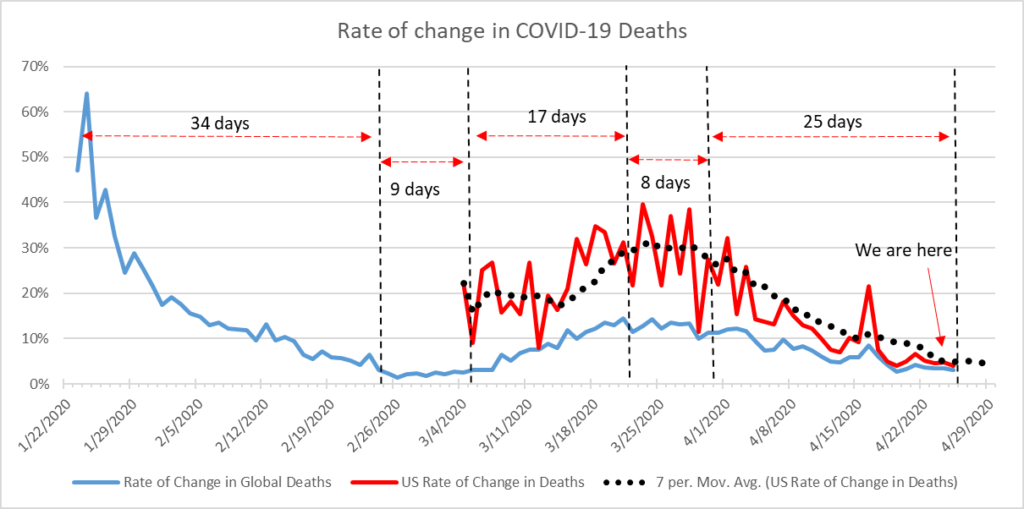
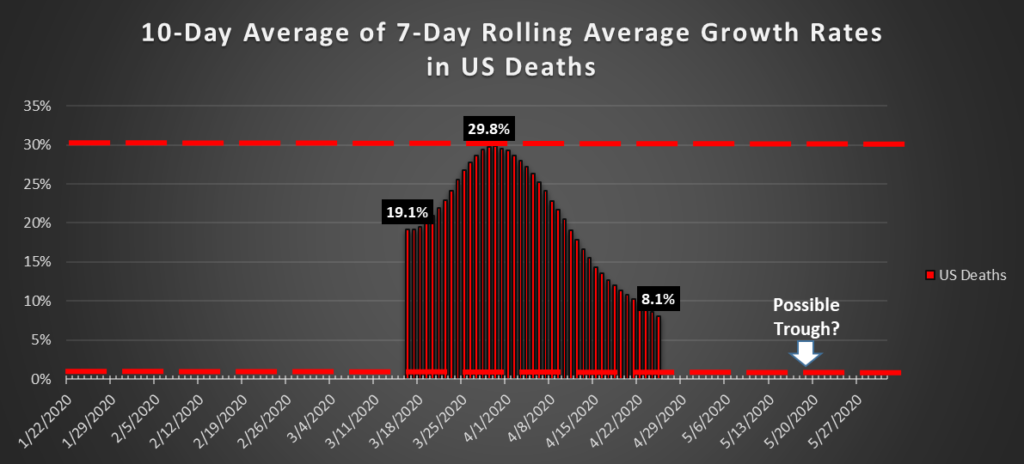
The convergence of the US growth rate curve with that of the Global curve suggests to me that the US is increasingly the driving portion of the global figure. From zero percent when the pandemic first appeared in the United States, today the US accounts for 26.7 percent of Global Deaths.
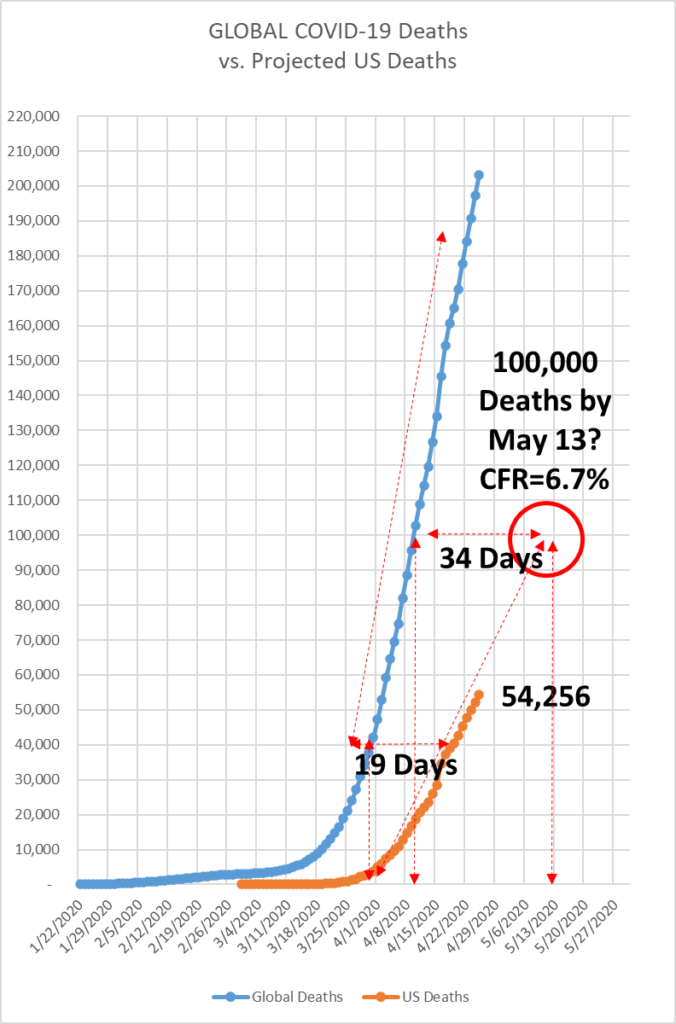
See the post of April 15 for a review of my projections since March 15. After undershooting the level of deaths in the US three times, I overshot the mark by six days with my April 10 projection of 750,000 Cases and 45,000 Deaths by April 15.
On April 21, when we did in fact reach 45,000 Deaths, I projected that we would reach 100,000 by May 20.
On April 23, however, I revised my projection to 100,000 by May 13.
Global Recoveries: up 4.78 percent, or 38,169, to 836,941.
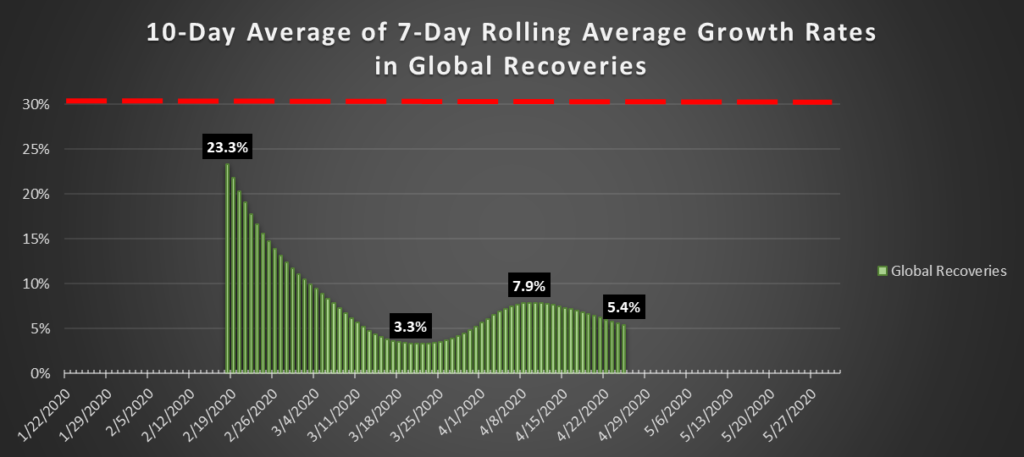
US Recoveries: up 7 percent, or 7,730, to 118,162.
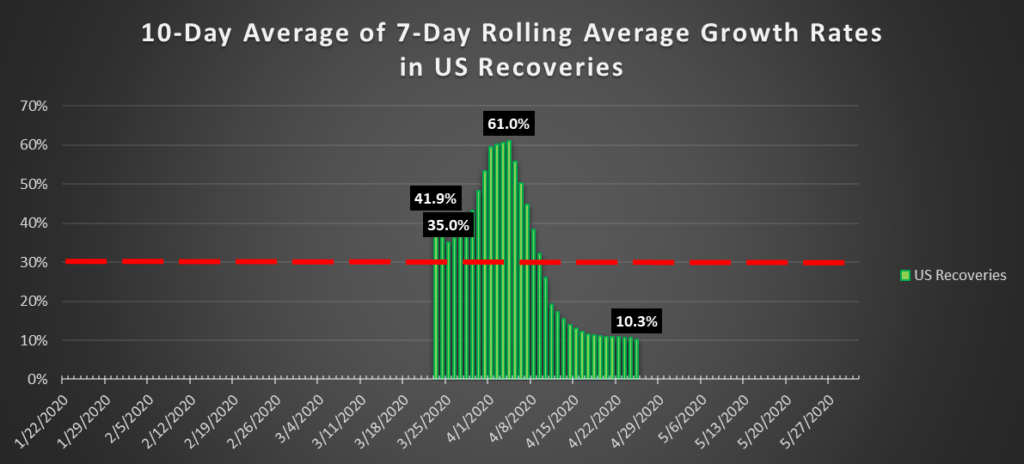
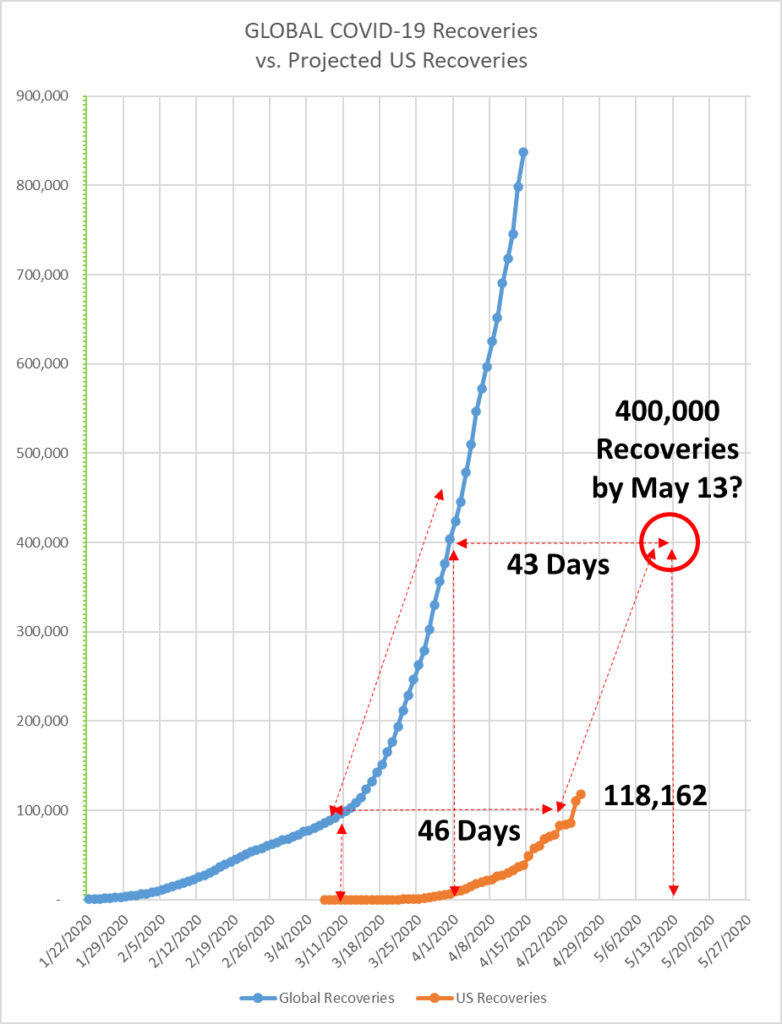
The US currently accounts for only 14.1 percent of Global Recoveries. I believe that this lower proportion, relative to Cases and Deaths, is merely a factor of time.
Global Unresolved: up 4.78 percent, or 38,169, to 836,941. The growth of 3.9 percent on April 23 seems to have marked the low point in the current wave of this curve. As this rate grows and grows, it will indicate a worsening in the strain on the Global health care infrastructure, which will be primarily focused in the United States.
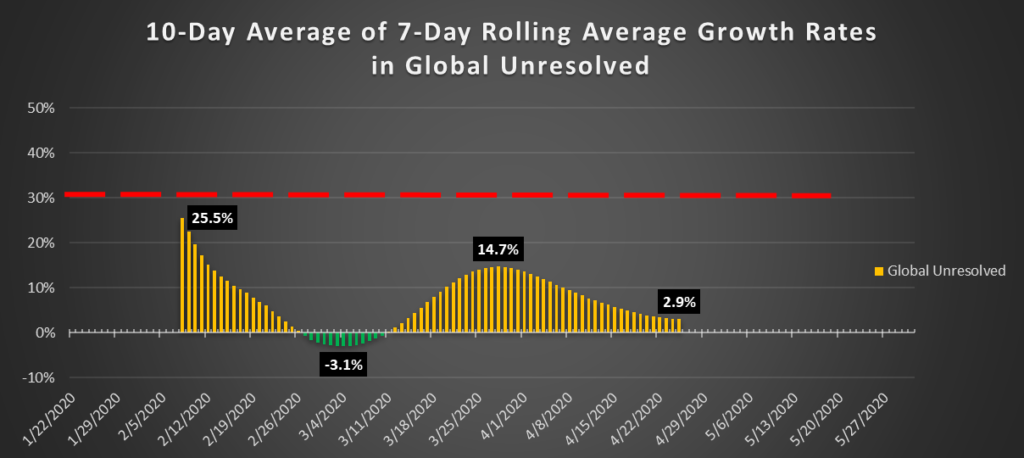
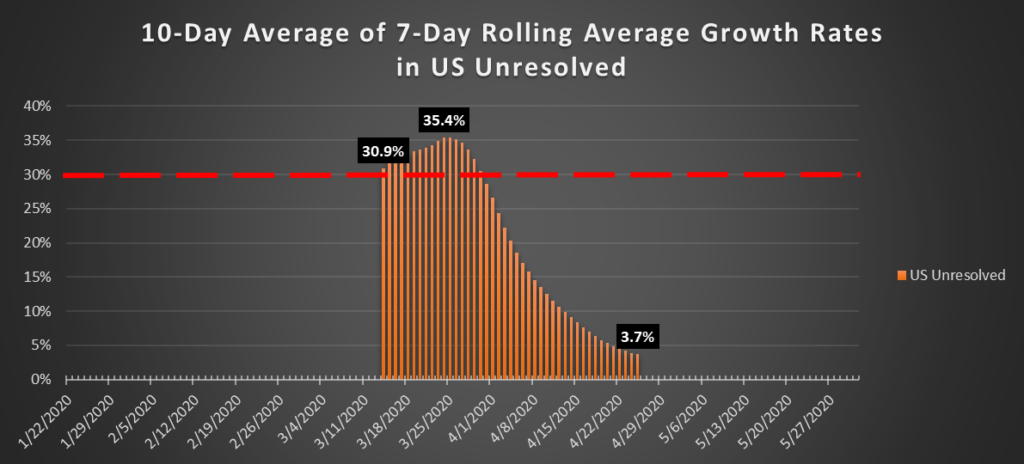
US Unresolved: up 3.4 percent, of 25,815, to 788,233. The US accounts for 42 percent of Global Unresolved.
Following is a chart that projects the number of deaths we might expect to see in the United States under three scenarios. Given the 54,256 deaths in the United States as of today, I have projected the curves if growth averages 5, 10, and 15 percent per day, respectively.
The actual current growth rate is 4 percent, and the bottom of the curve appears to be forming. This is the reason I have been so singularly focused on this metric for so many weeks. Once I recognized that the curve has a wave form, and that the peaks and valleys were representative of the movement of the global epicenters in the course of the pandemic, I understood that once the growth rate returns to increasing growth each day, the results will be catastrophic. It is one thing to have exponential levels of growth like 30 percent, decreasing slightly each day over a period of 30 days, when the base on which that growth rate is applied is relatively small. When the US rate of growth in Deaths was 35 percent on March 24, we had only 55,000 Cases and 775 Deaths.
But now, we are at nearly 1,000,000 Cases and more than 50,000 Deaths. We currently have growth rates of only 4 percent in each curve. Once the daily change in that growth rate turns to increasing, at an average rate of only 5 percent (which is optimistic), over 30 days we will be seeing daily deaths in the range of 3,000-10,000. Daily. At an average daily rate of 10 percent, that range changes to 5,000-86,000 Deaths PER DAY. At 15 percent, that range would be 8,000-468,000 Deaths PER DAY.
Now, I’m not saying that that is what is going to happen. I’m saying that, if it were to happen, this would be the implication.
I’ve presented the charts of the growth rates every day for several weeks, and I’ve predicted that troughs would form, which is happening now. If the Global data serves as a guide, then the curves will turn upward again after the troughs. What the average daily growth rate will be over the next 30 days, I cannot say. But below I show the simple mathematics of three scenarios.
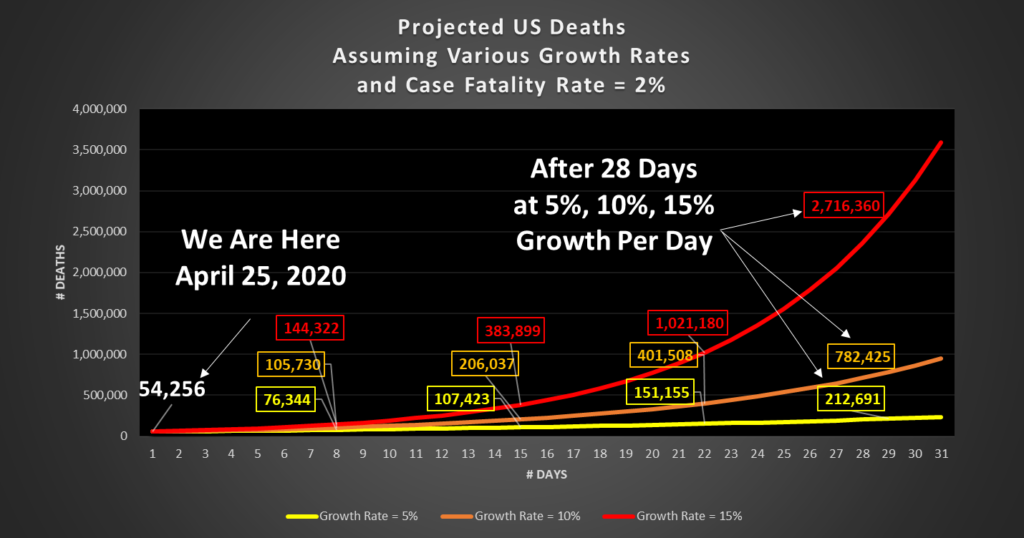
The only thing that I know of that will influence which of these three scenarios will be closest to what reality will bring us is the degree to which the US populace adheres to social distancing, reducing the virus’ opportunity to spread.
Please stay home and be well.
