April 15, 2020, 6:30 pm
#stayhomebewell for past, current, and future analysis of the COVID19 pandemic. stayhomebewell.org. and www.facebook.com/stayhomebewell. Instagram and Twitter, too. Please react and share on any platform you use. It still matters what people do.
I am skipping one day. I have the data for an April 14 update, but since today is April 15, and most of my projections were pointed at this date, I’ve decided that I’m going to document the totals as of now and bring out the predictions to compare them to the reality.
I listened to Governor Cuomo’s briefing yesterday. He was addressing things that I’ve been raising for several weeks. For example, he was saying that even though the number of new cases is slowing, there are still around 2,000 new infections being admitted to New York hospitals every day. Translation: we are not yet out of the woods.
He also addressed the fact that there are many deaths that have not been attributed to this disease. I wrote about that at least a week ago. So far, if you’ve been reading this blog, the news has not surprised you; rather, it has confirmed the information you already had. I’m breaking my arm off patting myself on the back here. But I’m doing it in the hopes that it will urge you to share this information widely so that we all suffer less, for a shorter time.
First, I’ll document the totals as usual. Then I’ll bring out the old projections.
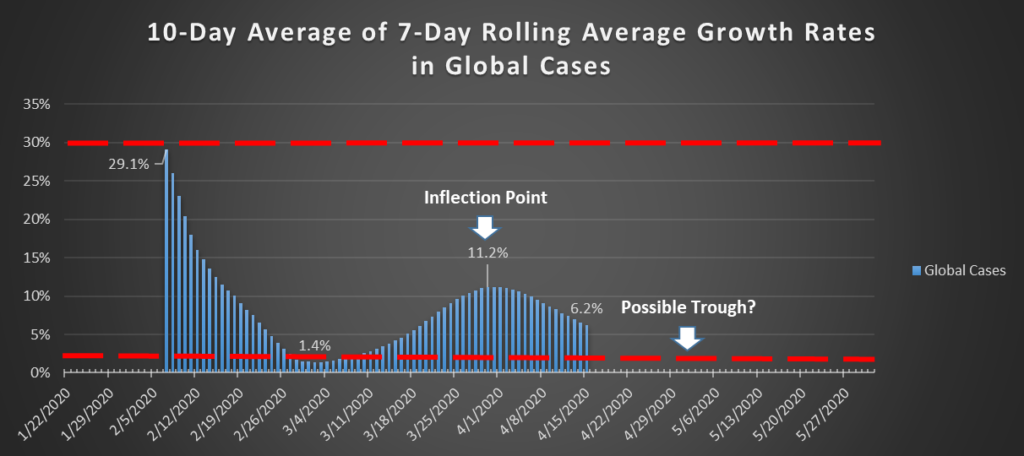
Global Cases: two days ago, up 3.89 percent (72,025), and yesterday up 3.83 percent (73,800). Today, with five hours still uncounted, up 3.76 percent (75,000), to 2,074,046. The world has passed the 2 million mark. The growth rate continues its decline from March 20 even as the absolute numbers continue to grow each day. The extended rolling average (the average of the last ten 7-day rolling averages) is 6.2 percent.
Don’t be surprised if it turns upward again within the next 7-10 days. If it grows over the next two days, then I think it will be safe to call the trough and declare that the next wave is coming.
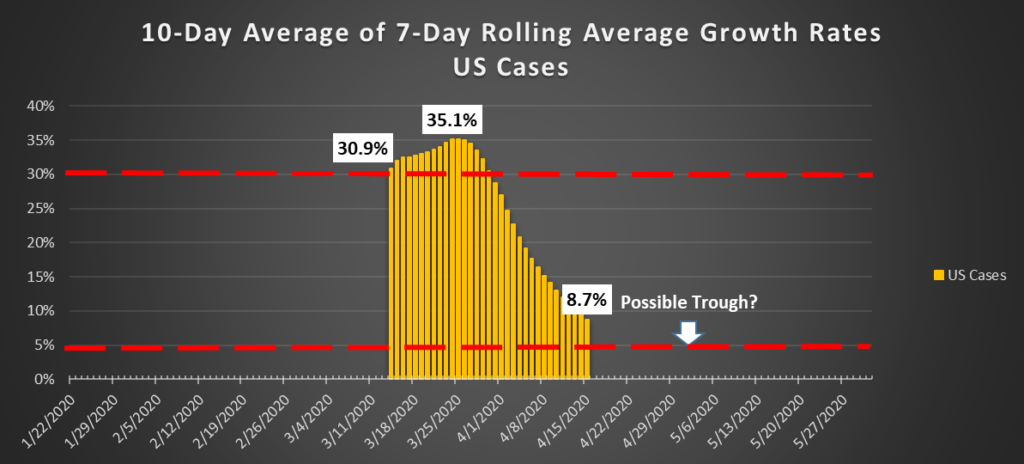
US Cases: The increase two days ago was 4.77 percent (26,722 cases), and yesterday was 4.55 percent (26,731—practically identical). Today, as of 6:30 pm, the growth rate in US Cases was 4.54 percent. In terms of absolute numbers, US Cases grew by 27,876, and that’s with a full five hours’ worth of data uncollected. Do you recognize the significance? While day-to-day totals can fluctuate, making it unreliable to call a “trend” based on a single day’s change, today could represent a bottom in the decline of the growth rate. Look at what I wrote yesterday.
The extended rolling average growth rate is 8.7 percent. I’ll go out on a limb and predict a bottom at 5 percent during the first week of May, followed by a return to rising growth rates.
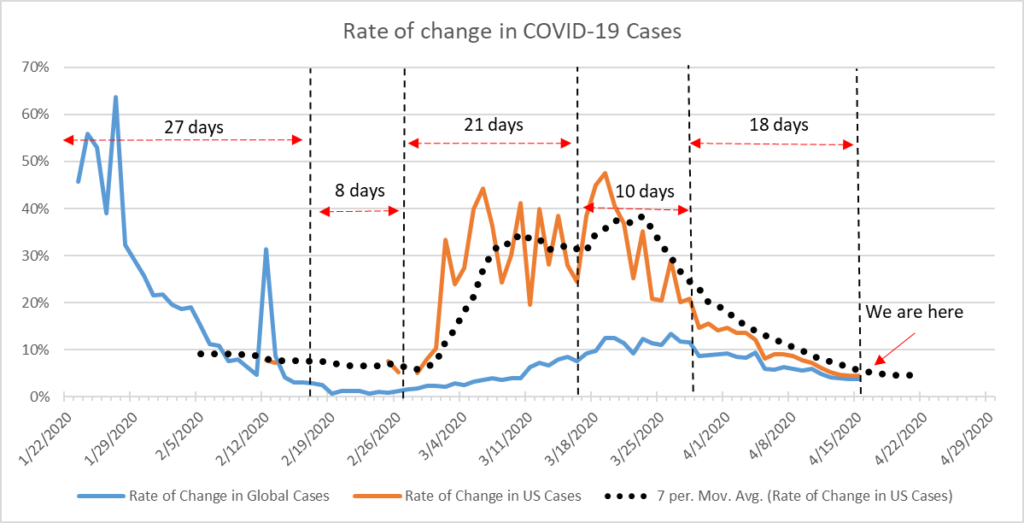
The chart below shows the timing in the global cases: 27 days of declining growth rates, followed by 8 days in a trough; then 21 days of increasing growth with roughly 10 days at a peak. We are currently 18 days into a decline. Hence, if the US were to follow the pattern of the Global experience exactly, we could expect another 9 days of decline, followed by 8 days in a trough.
There are two different time variables at play, it seems to me: the first is the course of the disease, from infection to development of symptoms to resolution in either recovery or death. This is likely consistent across all human populations (with the exception that in poorer countries with less access to advanced treatment, perhaps the course of the disease is faster). The second factor is likely highly variable, however, and that is the time between the development of epicenters across physical geography.
But, as I noted in yesterday’s post, the one thing that has been consistently true in the United States has been that the disease has progressed more quickly than just about anyone expected. So I could see a trough forming in the next 7-10 days.
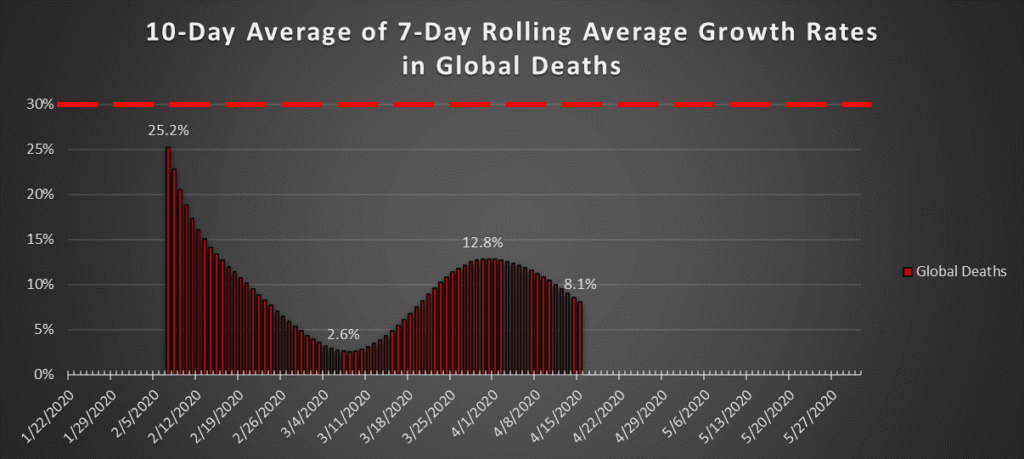
Global Deaths: On March 21, the daily growth rate in Global Deaths peaked at 14.4 percent. On April 12 and 13, the growth rates were under 5 percent for the first time since that peak, with absolute numbers of deaths at just over 5,400 on each of those two days. The growth rates on April 14 and 15 were both above 5.8 percent, with actual deaths numbering over 7,000 and 7,300 (again, with 5 hours’ worth of uncollected data for today, April 15). This is suggestive of a trough. The fact of the gradual convergence of the US growth rate with the Global growth rate suggests that the US is becoming the driving portion of the global number. I don’t think there is any risk in predicting that, some 90-180 days from now, the United States will be on the far side of its mountain, and the countries of the global south will become the drivers of the global numbers.
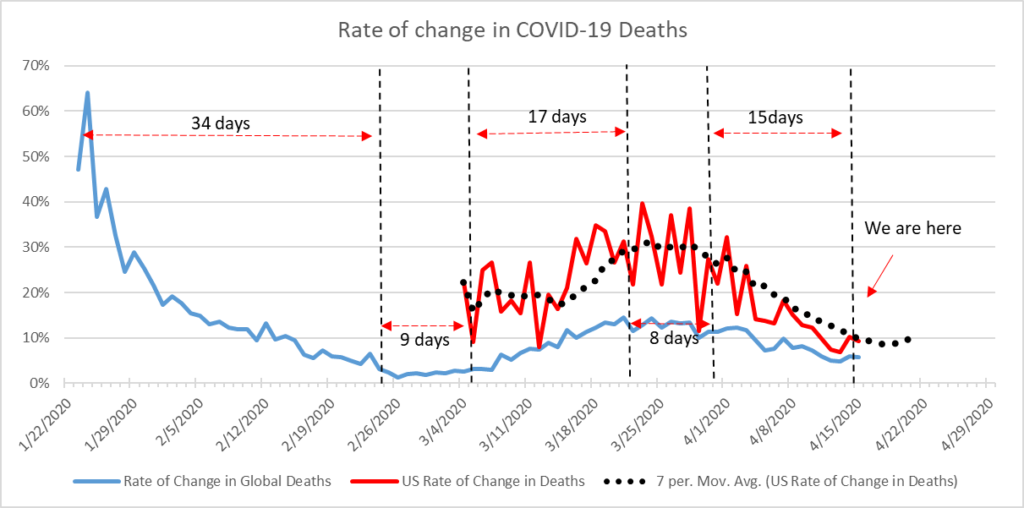
The extended rolling average is at 8.1 percent today.
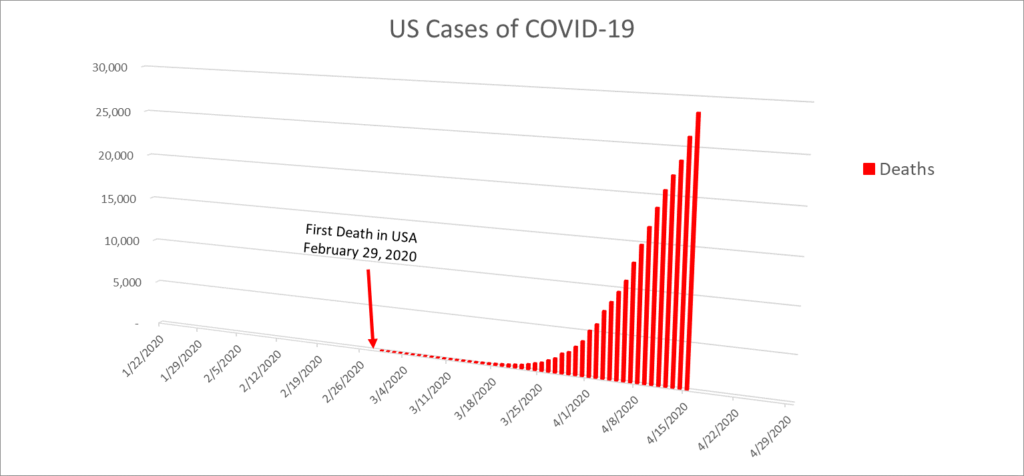
US Deaths: on April 14, an increase of 10 percent, or 2,400 deaths, the highest toll to date; today, with 5 hours uncounted, an increase of the same amount, 2,400, representing a 9.2 increase.
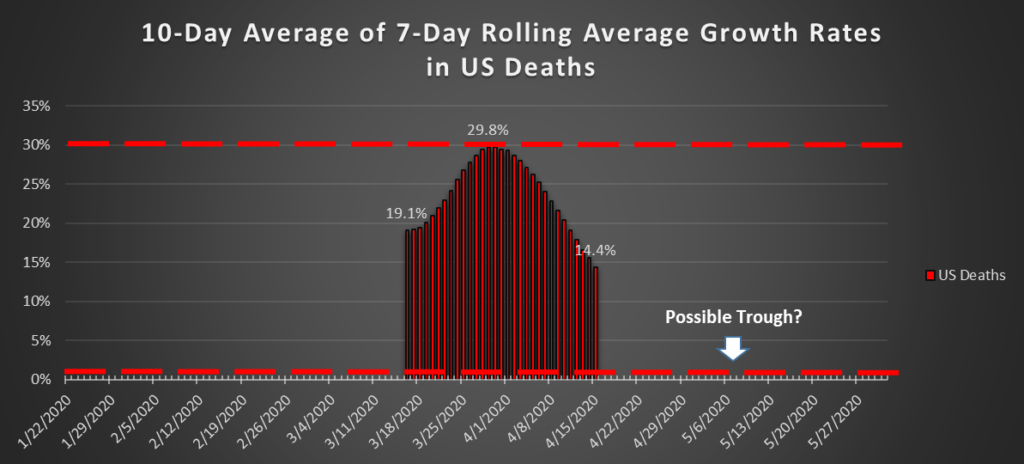
The extended rolling average in US Deaths stands at 14.4 percent. Based on nothing but the feel of the graphs, I’ll throw out a low-confidence prediction of a trough near zero growth around May 8, followed by a return to growth. This is a horrible prediction. I want very badly to be wrong.
Global Recoveries: The last two days have seen increases of 7.6 percent (33,900 recoveries) and 6.4 percent (30,600), bringing the total to 509,550. This is a recovery rate of 25 percent. Meanwhile, the Case Fatality Rate has been steadily increasing to its current level of 6.5 percent. Both of those figures are still evolving, since roughly 70 percent of cases are still Unresolved, globally. The Deaths, however, are relatively stable and growing throughout this pandemic, despite the ebbs and flows in new Cases and Recoveries.
US Recoveries: for some reason, there are wide swings in the growth rate from day to day. Yesterday’s recoveries grew by 5 percent, or 1,872; but today the number grew by 25 percent, or 9,700, to 48,500. This has to be due to some change in the way numbers are being collected or recorded.
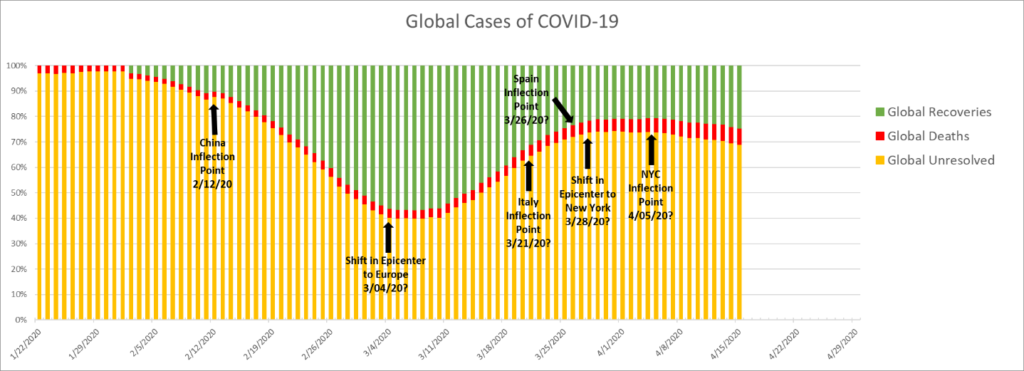
Global Unresolved: up by 2.4 percent (32,880) yesterday, and by 2.7 percent (37,100) today, bringing the total number of current illnesses to 1,430,425 worldwide. This is the chart that truly shows the global picture.
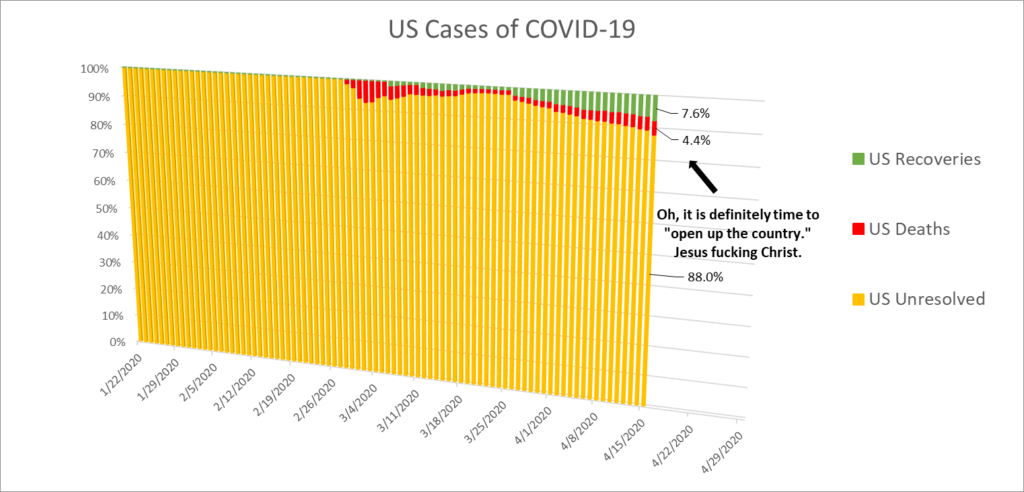
US Unresolved: up 4.25 percent (22,450) yesterday, and by 2.9 percent (15,800) today, bringing the number of current illnesses in the US to 564,800.
This is the chart that truly shows the picture in the United States.
Okay.
I’ve taken care of the housekeeping.
Now to the real party. Let’s pull my projections out of the archives and subject them to the scrutiny of hindsight.
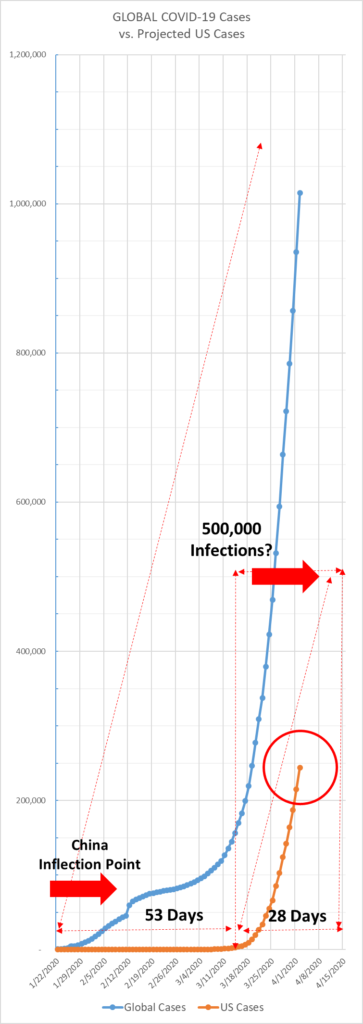
On March 15, the US was at 3,400 cases, 53 days behind the global number. I plotted the global curve and projected the US curve might bring us to 80,000 cases in four weeks, or roughly by April 15. Globally, there were 6,518 deaths, and 63 in the United States. I projected that by April 15, we would have 2,400 deaths, or a CFR of 3 percent. I put my marker down and began to fill in those projections, one dot per day.
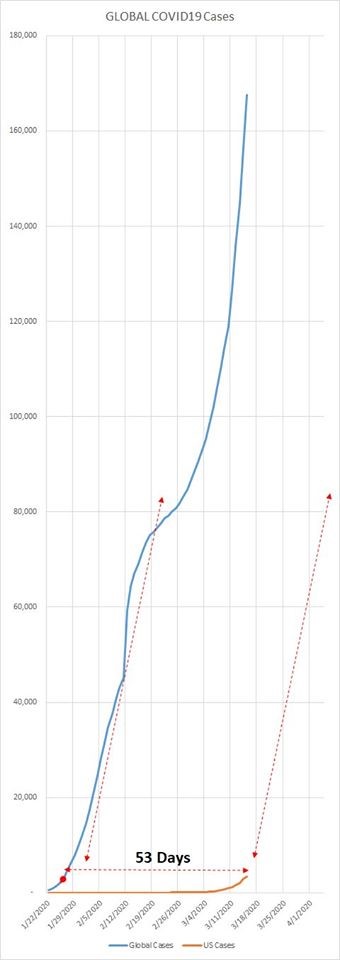
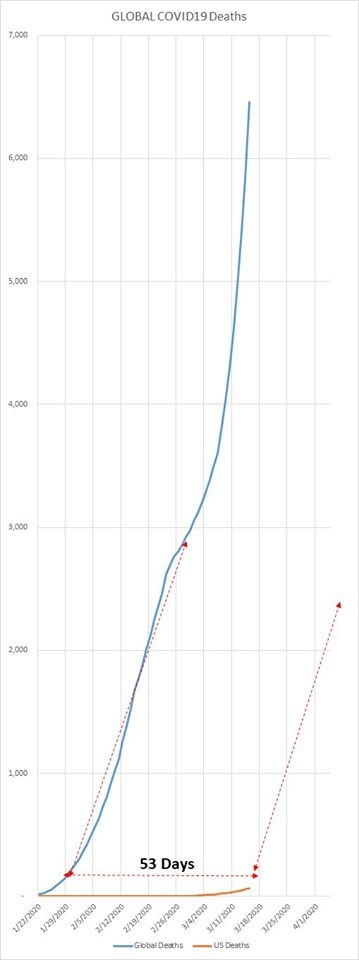
On March 18, I projected 67,000 cases and 2,000 deaths.
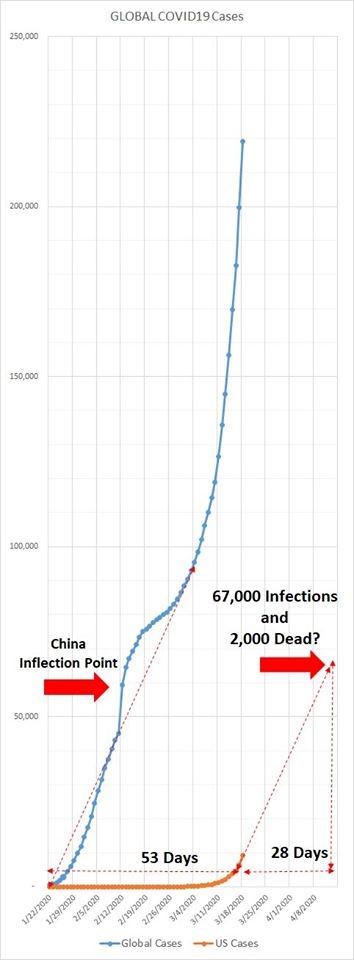
On March 19, we stood at 13,921 cases. I revised upward again to 80,000 cases and 3,000 dead based on the curve of the global figures, which assumed a doubling time of 6 days. I also stated that, if cases doubled every three days, then by April 30 we would have 150 million infections and 5 million dead (at a CFR of 2 percent). Today we stand at 640,000 cases. If that number were to double every three days, then after 15 days we would be at 32 million cases and would not reach 150 million until six days later.
In fact, it took us 28 days to go from 13,921 to the 641,762 we have today. By my March 19 projection, we would have reached this level after only 15 days. In other words, I was off by 13 days. I believe this may be evidence of the positive effect of social distancing throughout the country over the last 21-28 days.
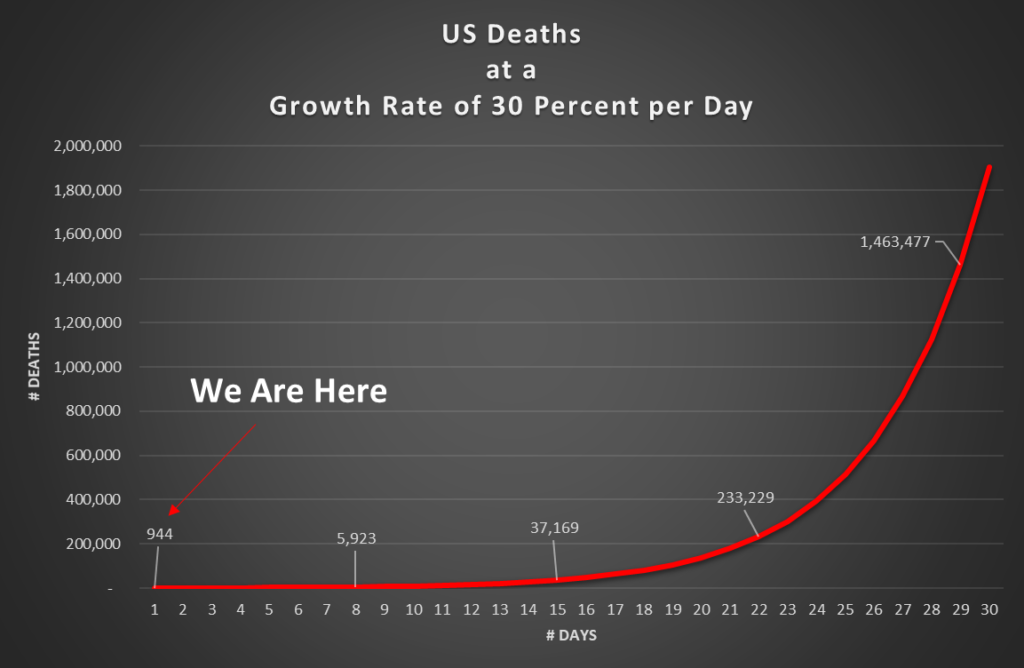
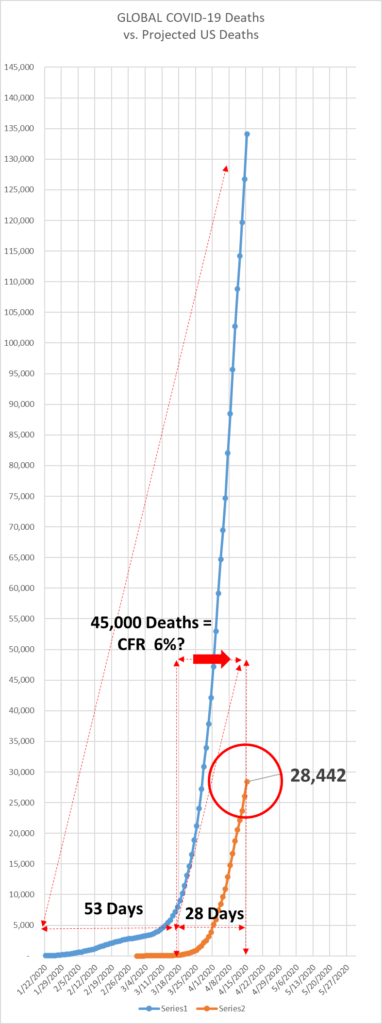
On March 25, I showed what the simple mathematics had to tell us about exponential growth. We had 944 deaths at that time. I showed that if that number grew by 30 percent per day, then after 30 days we would reach 1,463,477. It showed that after 21 days, or by April 16, we would reach 233,229 dead. Today we are in fact at 28,442. This means that my projection was too aggressive by eight days.The actual average daily growth rate that brought us from 944 to 28,442 was 18 percent.
By March 29 it had become clear that reality was overtaking my projection, so I modified my curve. This brought me to project 200,000 infections and 11,000 deaths by April 15.
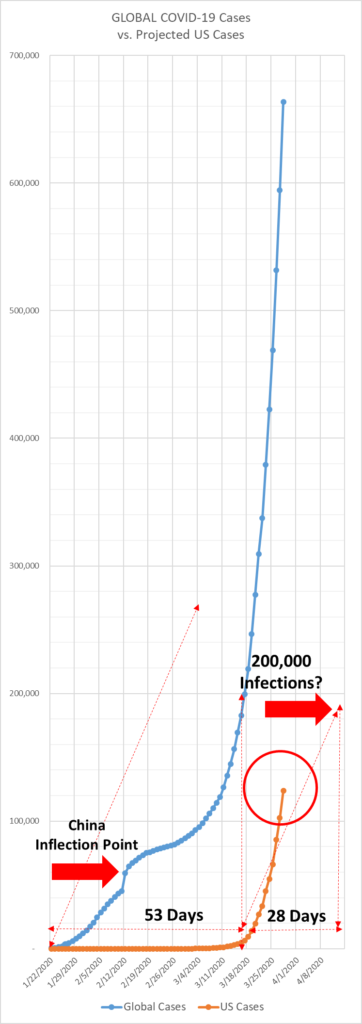
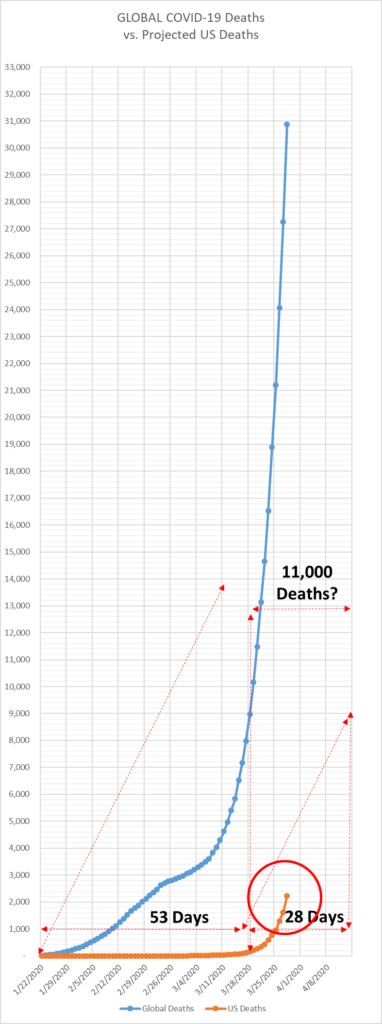
On April 2, I revised upward again to 500,000 infections and 23,000 deaths.
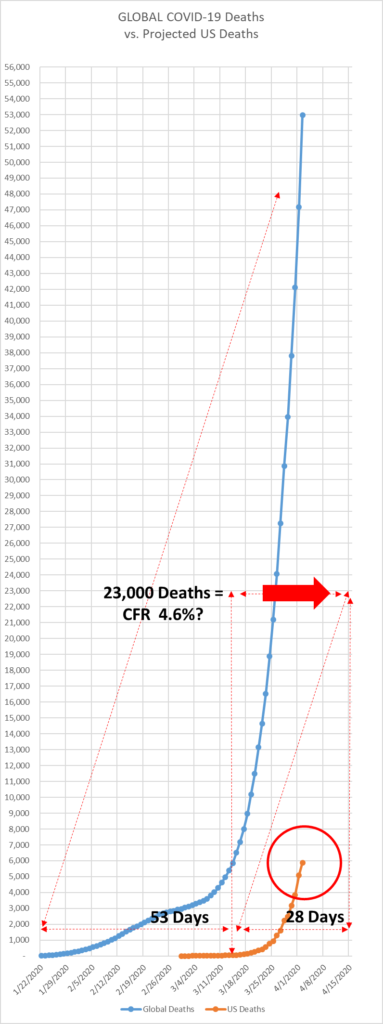
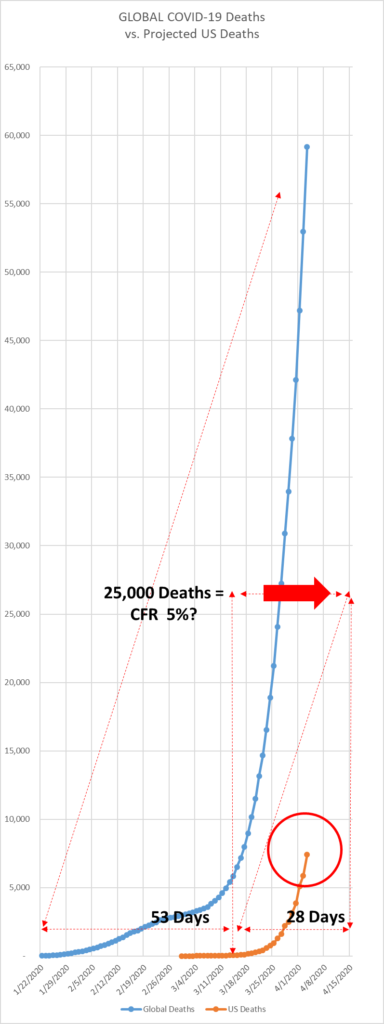
On April 3, I revised the death count up to 25,000.
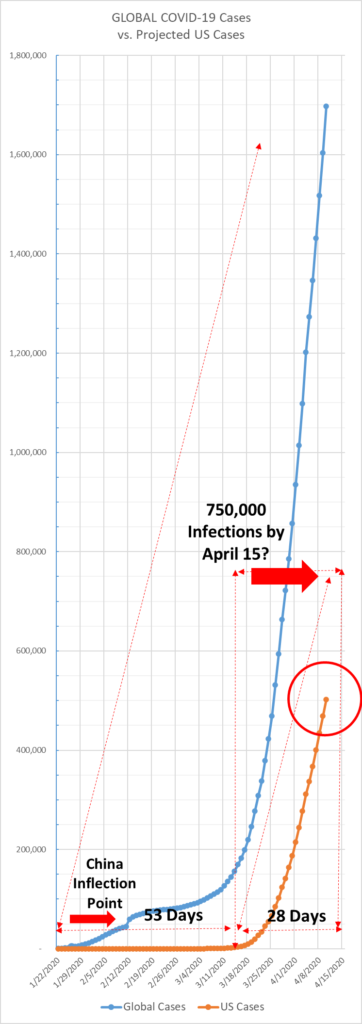
On April 10, I revised upward again to 750,000 cases and 45,000 deaths, overshooting the mark.
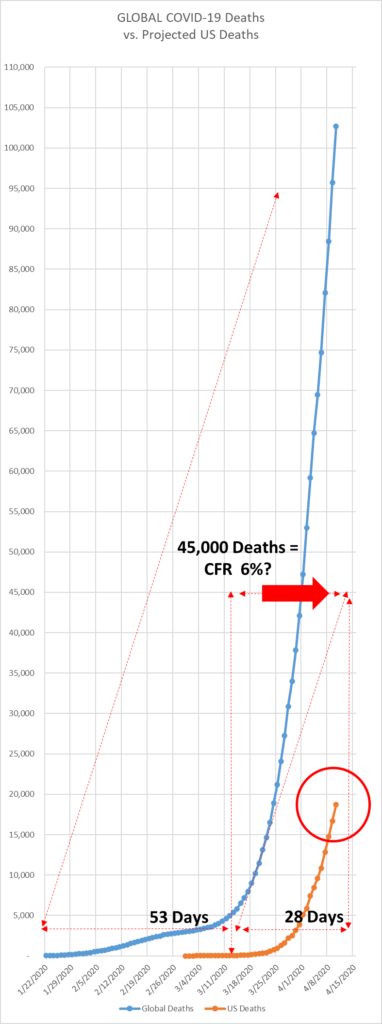
Here are the actual data for April 15, 2020:
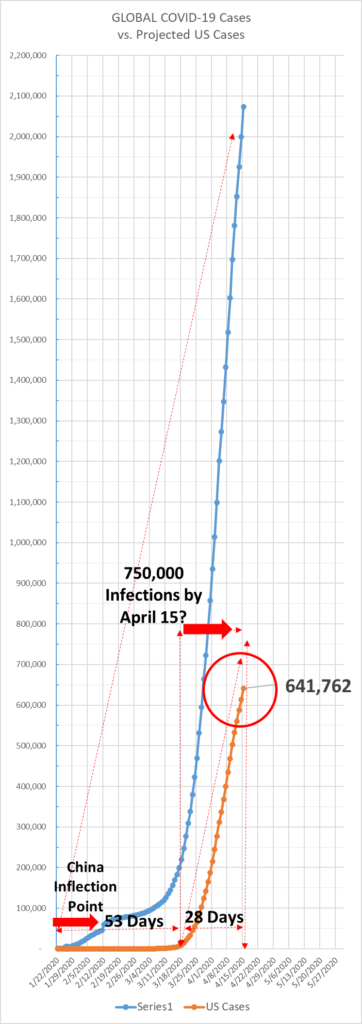
We are currently adding 28,000 cases per day. This means my projection was off by just under four days.
With regard to the current Death count, we are at 28,442, and I projected 45,000. We are currently adding around 2,000 per day, which means that my projection was off by eight days, or I should have assumed a case fatality rate of 3.8.
Now, compare this report to what you were hearing on the news over the last four weeks.
What does that suggest to you about what you are hearing on the news today?
