“I don’t know nuttin’, I just work here.”
April 11, 2020 11:45 pm
#stayhomebewell for past, current, and future analysis of the COVID19 pandemic. stayhomebewell.org. and www.facebook.com/stayhomebewell. Please react and share on any platform you use. It still matters what people do.
The latest news fad is all about how the original estimates were all too high. New York didn’t need as many beds as it had feared. We don’t know the actual denominator, so the Case Fatality Rate (CFR) is much lower than originally estimated. Fauci says that we might get out of this with as few as 40,000 deaths because social distancing has really done what it was intended to do.
As I’ve been saying all along, I hope to god that I am wrong about all of the conclusions I’ve been taking from the data. And I don’t know the first thing about medicine or epidemiology. I will be overjoyed if it turns out that I have in fact been a Chicken Little and have been catastrophizing all of this.
But all you have to do is go back to the start of this blog and see what I wrote as early as March 15. Then look at what is actually happening today.
Now, what I write today may not bear out four weeks from now, but I am, and have been, putting my markers down each day and am open to scrutiny.
Again: I don’t have any opinion about any of this, because I am not qualified to have one. I am not admitting my ignorance of these subjects, I am DECLARING it, and have been from the start.
All I am doing is taking three simple numbers–the reported Cases, Deaths, and Recoveries on the global scale and in the United States–and am plotting them on a graph. Then I’m just taking some averages, some ratios, adding some numbers together, subtracting some numbers from one another, and plotting those on graphs as well. Then I’m just reporting what those graphs look like, and making guesses as to why they look the way they do.
The current theme of the last 24-48 hours of news cycle, that everything appears to have been overblown in the face of “very promising” figures, just seems like more happy sounds to me, I’m afraid.
The idea that New York was the first and will be the last of it, and that, just because the numbers are decreasing there as New York comes out of its onslaught, we should not expect similar onslaughts throughout the other population centers of the country, seems indescribably naïve to me. But again, I loudly declare that, “I don’t know nuttin’, I just work here.”
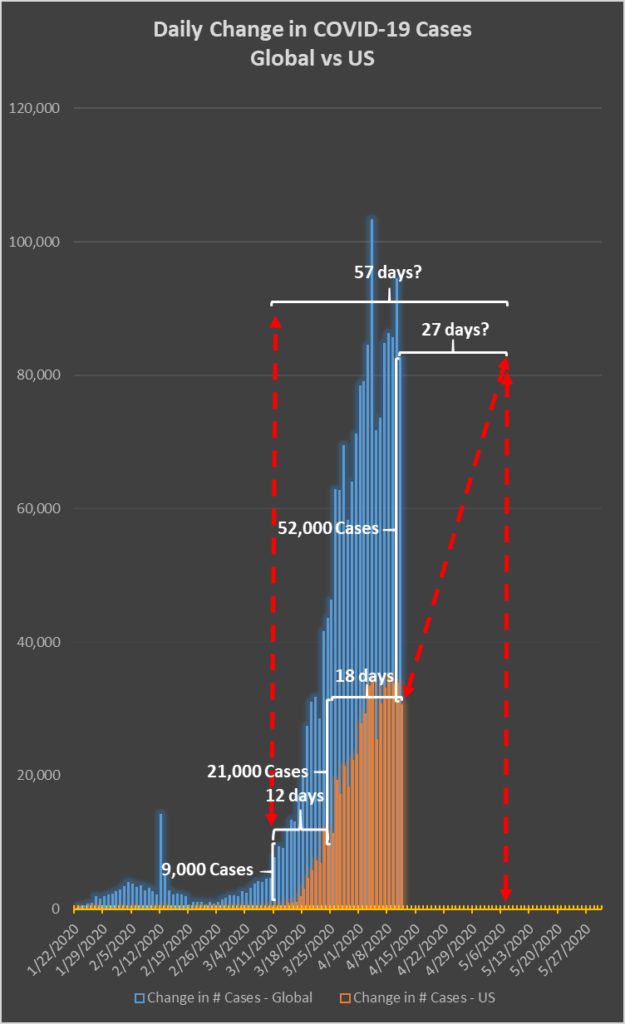
Global Cases: up 4.86 percent, or 82,500 new infections recorded today, bringing the worldwide total to 1,780,315. This is the lowest growth rate since March 10, when the number of cases was 120,000.
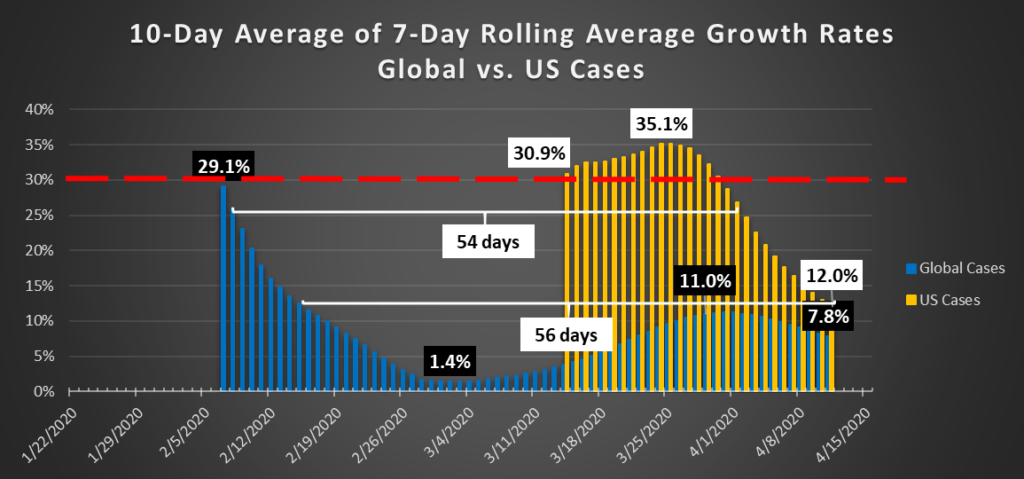
US Cases: up 6.1 percent, or 30,560 new recorded infections today, to 532,875. The rate of increase is decreasing, as the base from which that figure is calculated continues to grow.
Global Deaths: up 6 percent, or 6,135, to 108,825. The Case Fatality Rate (CFR) is 6.1 percent, the highest to date.
US Deaths: up 9.9 percent, or 1,852 deaths today, to 20,575. The first US death occurred on February 29. The second was on March 1. That rate of increase was 100 percent. One the next day, there were four deaths, an increase of 200 percent. I exclude these early increases, because they are misleading. However, over the 39 days from March 4 to today, US saw its death count increase from 11 to today’s figure of more than 20,000. Over those 39 days, the average daily rate of increase has been 22 percent. There have been individual days when the growth rate fell by a noticeable amount, but those days are surrounded on both sides by higher figures. Today’s growth rate of just under 10 percent is the lowest we have seen since March 12, when it was 8 percent, and the US total was only 41 deaths.
Again, it is possible that New York is on the downward slope of its mountain, but I am confident in predicting that the US has many more mountains yet to face.
Again, I hope to god that I am wrong about all of this.
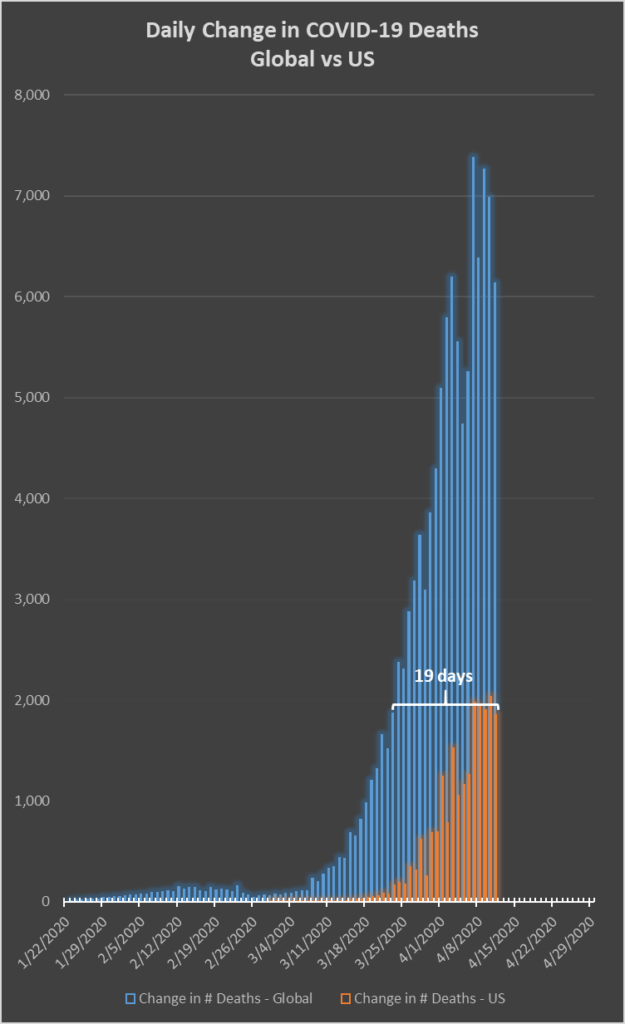
Global Recoveries: up 7.4 percent, or 27,850, to 404,000.
US Recoveries: up 11.5 percent, or 3,140, to 30,450 who have been documented as having had the virus and recovered. Of course, it is possible that the actual number is orders of magnitude higher than this, as they would have either had no symptoms or mild symptoms (remember what “mild” means?). It is possible that 300,000, or 3,000,000, or 30,000,000 people in the United States have actually already had this virus and recovered. We just can’t know what we can’t know, and we will never know if the US doesn’t figure out a way to test everyone.
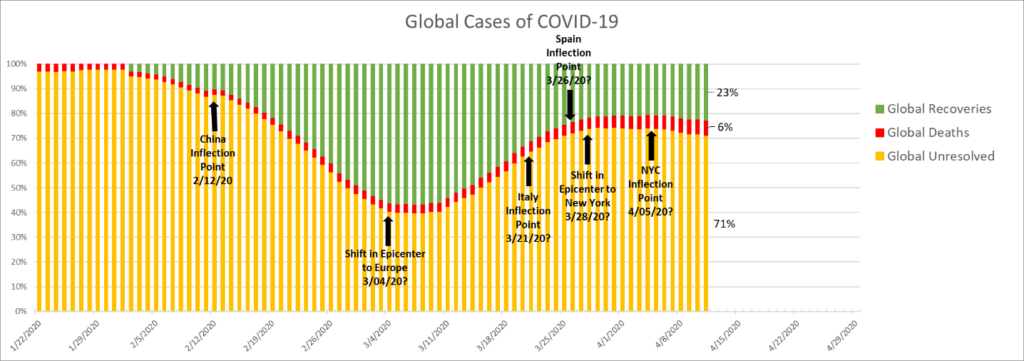
Global Unresolved: up 4 percent, or 48,500, to 1,267,500 currently infected worldwide, nearly 40 percent of whom are in the United States. Global Unresolved are currently 71 percent of all Cases, while Deaths make up 6 percent, and Recovered are 23 percent.
The proportion of Global Unresolved has been trending downward since holding at 74 percent for ten days from March 28 to April 6, while Deaths have increased from 5 percent and Recovered are up from 21 percent. This is neither good nor bad, in my opinion. It merely is a representation of the wave-like patterns of the movement of the pandemic geographically.
I predict that the number of new Cases entering the pipeline will be lower for a short period of time, perhaps ten days, as the rate of decrease in New York is greater than the rate of increase in other epicenters to come.
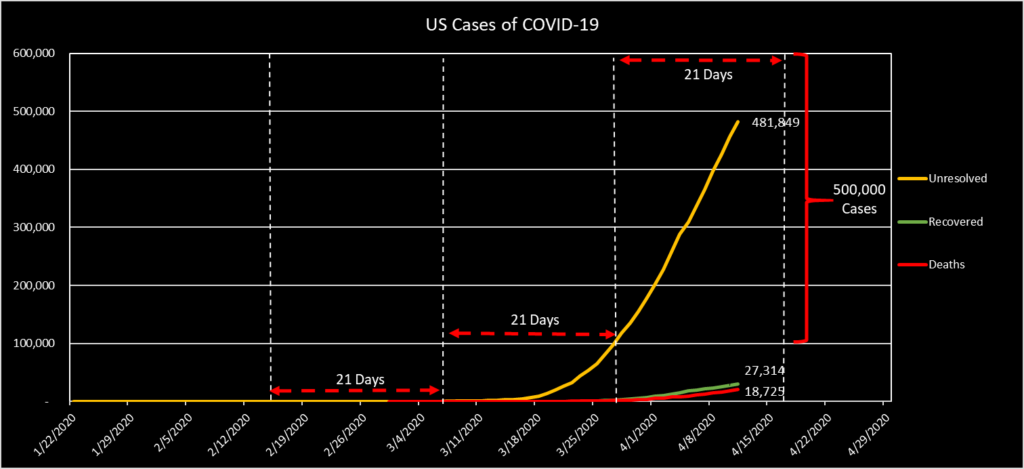
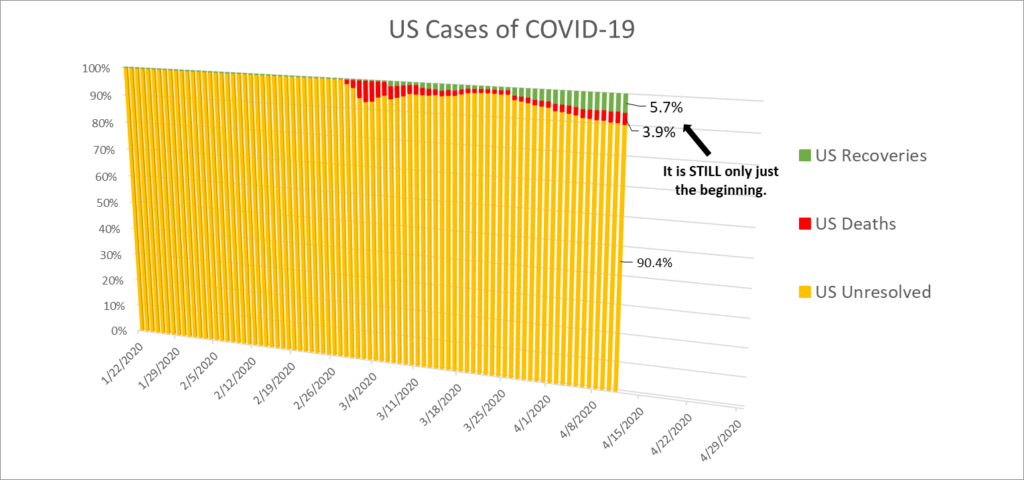
US Unresolved: up 5.6 percent, or 25,570, to 481,850 currently grappling with COVID-19 to one degree or another in the United States. This is the lowest rate of increase since February 28, the day before the first death in the United States.
Again, I suspect that this is a manifestation of the slowing number of cases in New York not yet having been supplanted by the increases that are coming throughout the rest of the country. Waves that will inevitably hit forty-nine other states have yet to crest. Some of them are barely noticeable, as they have case numbers still in the hundreds, not in the thousands.
Now, if they have implemented and strictly adhered to serious shelter-in-place orders, then perhaps their rates of doubling will not be 2-3 days, as was the case in New York for its first 30 days or so, but closer to 4-5 days. Okay, let’s make that assumption. All that means is that the time lag between now and when other population centers reach New York levels will be a few days later than they might have been otherwise.
Right now, New Jersey is in second place after New York with 58,000 cases and 2,200 deaths. I’m not saying I can make an exact prediction, but I can make a simple calculation that, if the rate of doubling is, say, 5 days, then in five days New Jersey will see 120,000 cases and 4,400 deaths, and in another five days, 240,000 cases and 8,800 deaths.
Of course I know that numbers cannot simply increase forever. The upper boundary is the total population, so there is a physical limit to growth. And at some point, herd immunity has an effect. And at some point, social distancing will produce its intended effect. But was that day yesterday? Hell no.
Michigan now stands at 24,000 cases and 1,400 deaths. That means 100,000 cases and 6,000 deaths in ten days.
Massachusetts has 23,000 cases and 700 deaths. Call it 90,000 cases and 3,000 deaths in ten days.
California has 22,500 cases and 630 deaths. 90,000 and 2,500.
Pennsylvania has 22,000 cases and 500 deaths. 88,000 and 2,000.
Louisiana? 20,000 and 800. That means 80,000 and 3,200. Maybe it won’t be ten days. Maybe 15. Maybe only eight. But it is coming, as sure as you are reading this.
Illinois. Florida. Texas. Georgia. Do I have to go on?
Well?
Geniuses?
Can you figure it out?
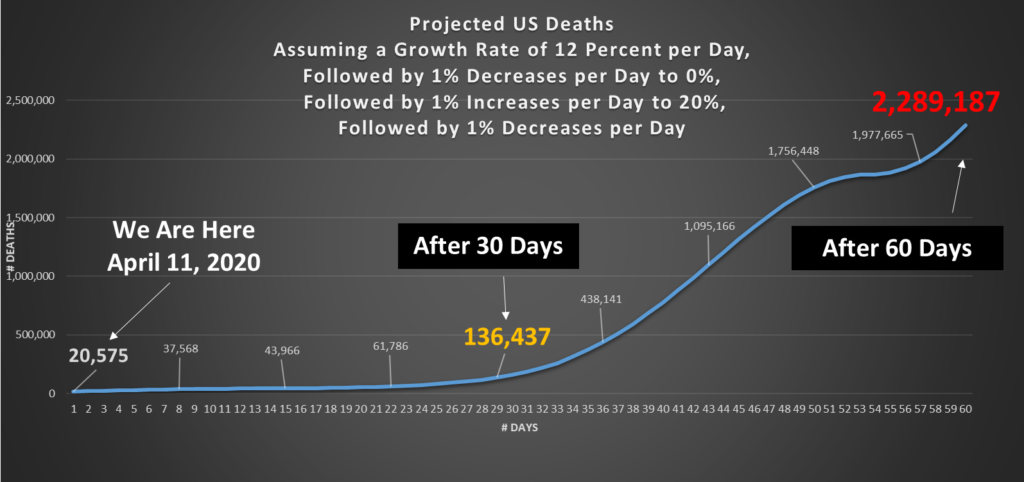
For the ease of calculation, the United States has 500,000 cases and 20,000 deaths. At a doubling rate of five days, that means 2,000,000 cases and 80,000 deaths in ten days. Maybe it’ll take fifteen days. Maybe twenty. But there is no way we out of the woods yet.
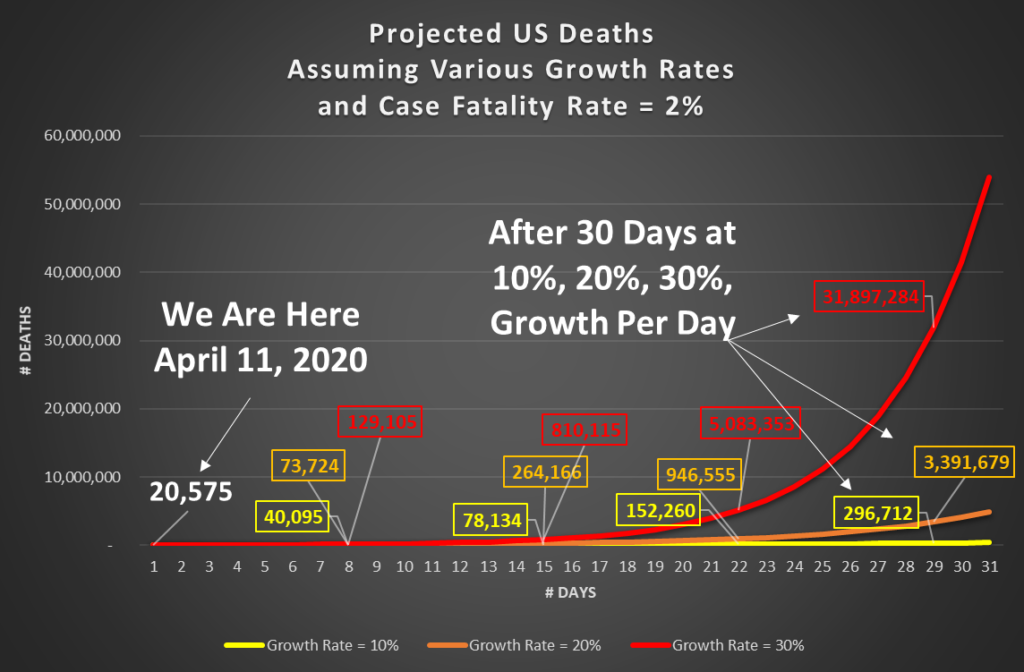
Alternatively, a more conservative model:
But what do I know? I don’t know nuttin’. I just work here.
