The Blind Men and the Elephant
April 9, 2020 9:00 pm
#stayhomebewell for past, current, and future analysis of the COVID19 pandemic. stayhomebewell.org. and www.facebook.com/stayhomebewell. Please react and share.
The first thing to note is that none of us has enough information with which to properly analyze or make predictions about what is happening. We don’t know the denominator. And we don’t even really know the numerator.
Denominator: How many people have been infected with the corona virus and have had COVID-19? No one knows. It is generally reported that some 80 percent of those infected will have anywhere from no symptoms to mild symptoms. By what has come to be known as Rumsfeld’s Law, we don’t know what we don’t know. What portion of the infected have had no symptoms, and therefore don’t know that they ever had the virus? We don’t know, and until we conduct tests of everyone in the country, which is very unlikely, we will not find out.
Numerator: How many people have come to a hospital, been tested, been admitted, and then either recovered or died is known. But how many people made a phone call to a doctor, were told to assume they have the virus, and to stay home? How many of those people recovered? How many died in their homes? A nurse I wrote about yesterday says that DOA bodies brought to her hospital are neither tested nor counted. So the numerator is also unknown.
We are like the blind man in the parable who only holds the elephant’s tail and says, “An elephant is like a rope.”
The news today is full of stories of hope, how we our worst days are behind us and we are coming out the other side. This is patently ridiculous. It is likely true that New York City’s worst days are behind it, and it may be coming out the other side of its wave. But New York is only the first of many waves. State after state, city after city, and all of rural America are waves that have yet to crest. The prison population in America is roughly the size of houston, but there are no McMansions in which to shelter.
The other major theme in the news today is that food banks across the country are being overwhelmed by demand from people who have run out of food and run out of money. But talking about the social and economic dominoes that all but have to fall in quick succession are not the subject of this blog. The subject of this blog is merely to measure the numbers being reported and try to extract insights from them.
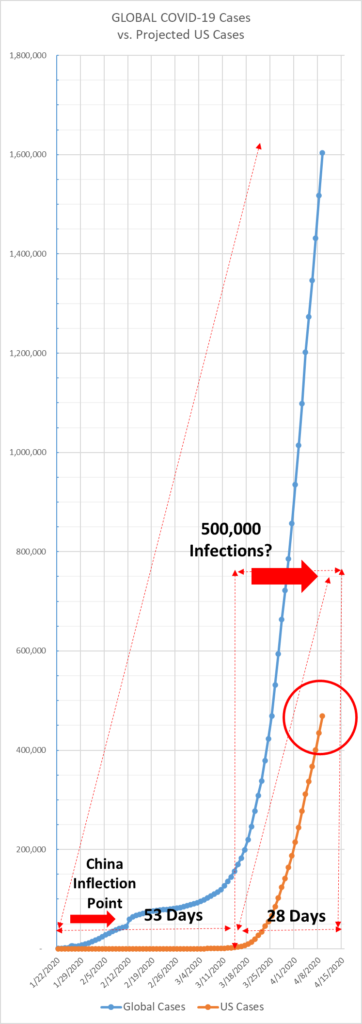
Global Cases: up 5.64 percent, or 85,600, to 1.6 million. Between March 19 and 28, the average rate of growth in Global Cases was 11.72 percent, and has been declining to the current level since that time. This measure has been undulating since the beginning of the pandemic, starting at an unrepresentatively high level (the increase from one case to two cases is 100 percent, after all). Its progression has been as follows:
- Decreased for 27 days from roughly 50 percent per day to a level near 1 percent per day;
- Held at an average of 1 percent for 8 days;
- Rose over 21 days to 10 percent,
- Held at an average near 12 percent for 10 days;
- Decreased to the current level of 5.64 percent over the last 12 days.
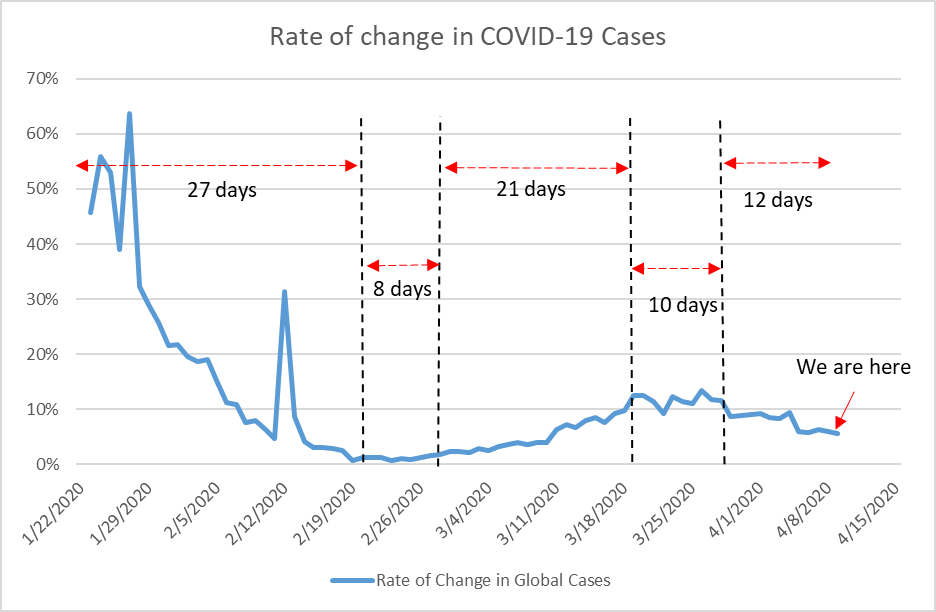
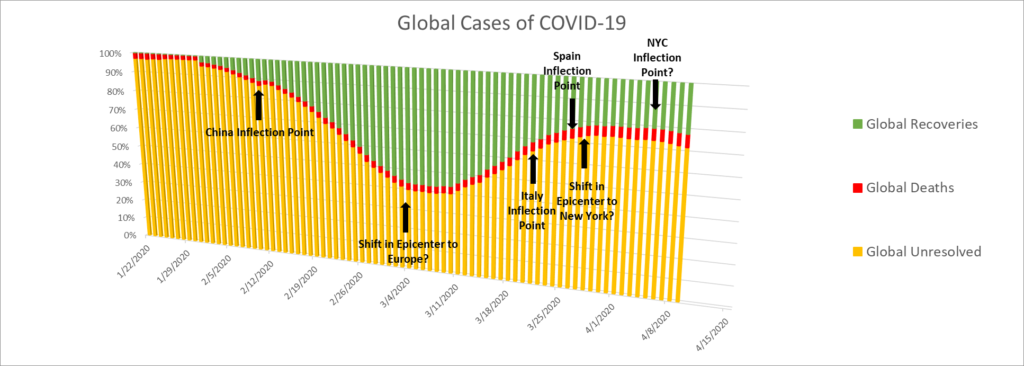
These undulations likely correspond to the waves passing through one epicenter and moving to another. So far, we have had epicenters in China, Italy/Spain, and New York. The durations of those sections of the curve likely have to do with the sizes of the populations, the severity/effectiveness of the containment measures employed, and other factors that I don’t know enough about to speculate on. The levels of the hills and valleys in the curve likely have to do with the size of the base populations at a given time (1 case is a 100 percent increase at the start of the pandemic, but 1,000 cases is only 1 percent once it has snowballed). But there are certainly insights to be gleaned from these facts about the durations of the ascents, peaks, descents, and valleys.
US Cases: up 7.75 percent, or 33,640, to 468,570. Overlaying the chart of the growth rate of US Cases into the same time parameters reveals the following:
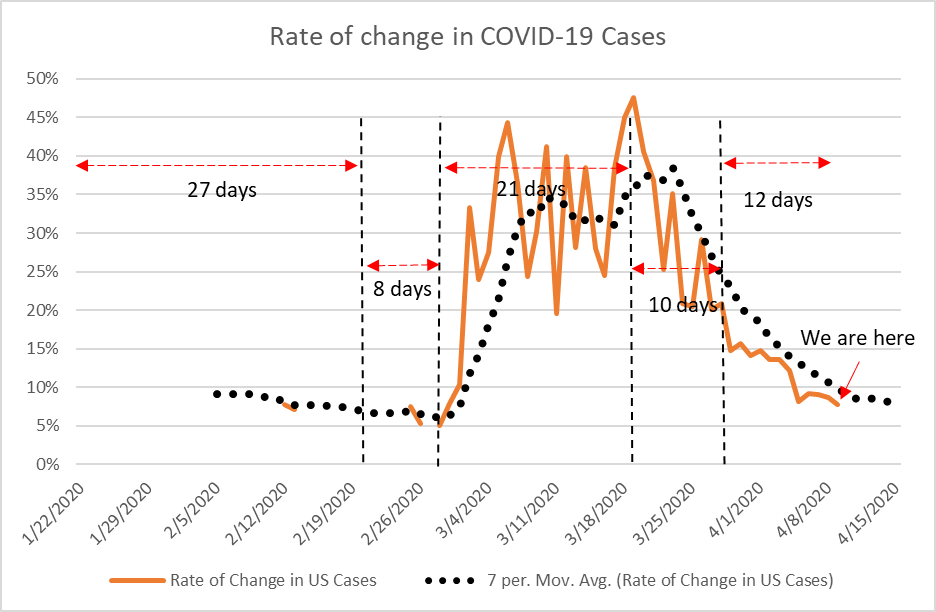
I anticipate that we will see a bottoming out in the coming days, representing the downside of the New York mountain, followed by a new ascent which will likely represent New Jersey. As the subsequent waves in the United States come closer and closer together in time, the troughs will be at rates greater than 1 percent. And as the base number of US cases to which those percentage increases refer grows and grows, the peak plateaus will be found at progressively lower levels.
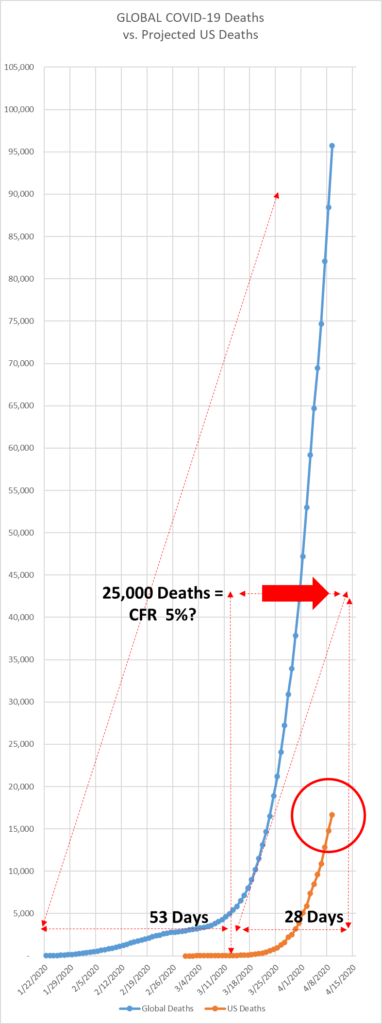
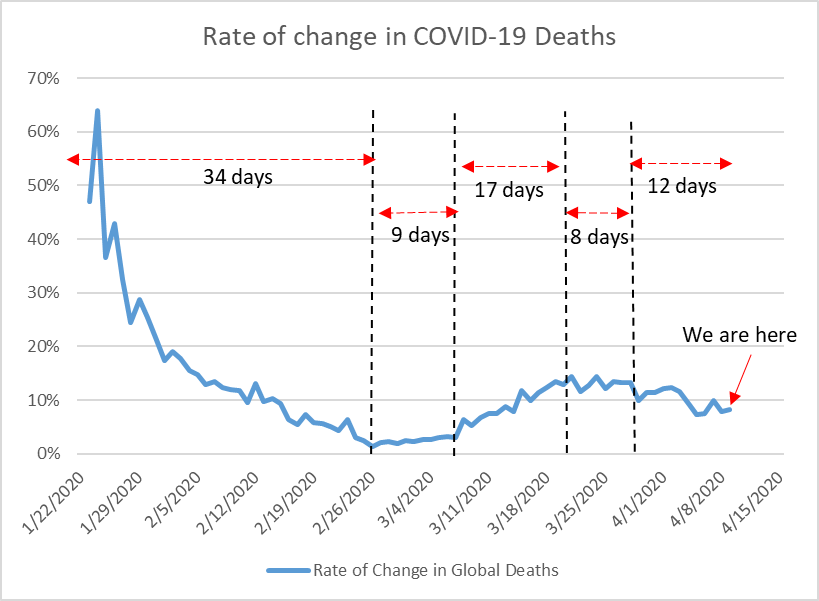
Global Deaths: up 8.2 percent, or 7,260, to 95,700.
- 34 days to decrease from roughly 50 percent per day to 2 percent per day;
- 9 days averaging 2 percent per day;
- 17 days to a peak of 14 percent per day;
- 8 days at a plateau averaging 13 percent per day;
- 12 days of decreasing growth to today’s level of 8.2 percent.
US Deaths: up 12.9 percent, 1,900, to 16,700.
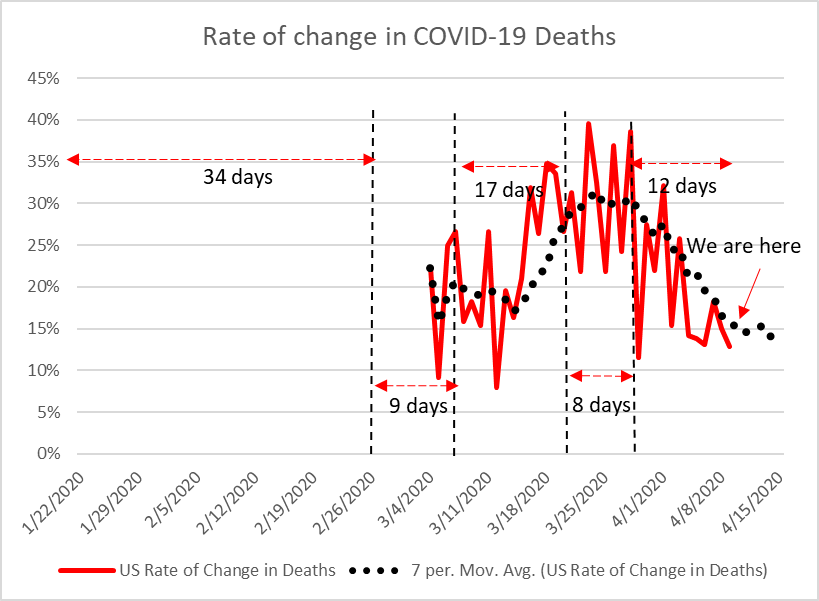
Since the epicenter shifted to the United States, cases, deaths, and recoveries in this country have represented a greater and greater portion of the global numbers. Once the numbers of infections start to grow exponentially in the major population centers of Brazil, Africa, India, and other countries, the US numbers will be eclipsed and will represent a diminishing portion of the global figures.
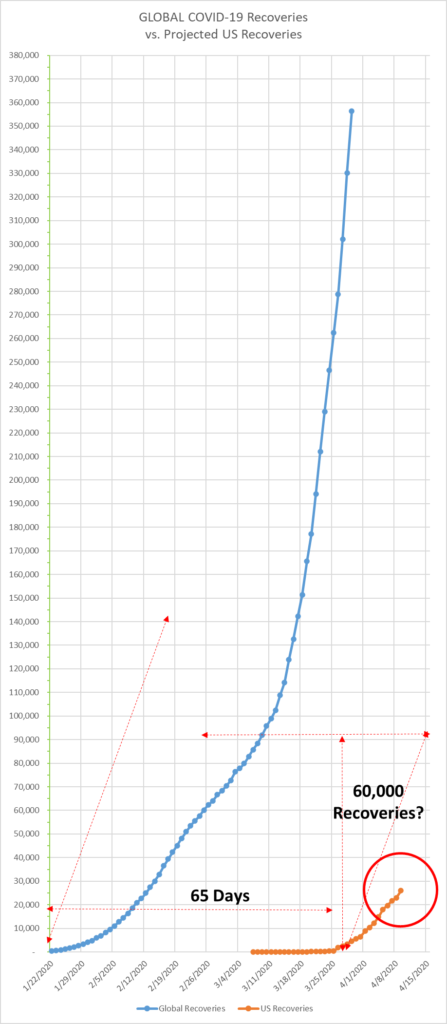
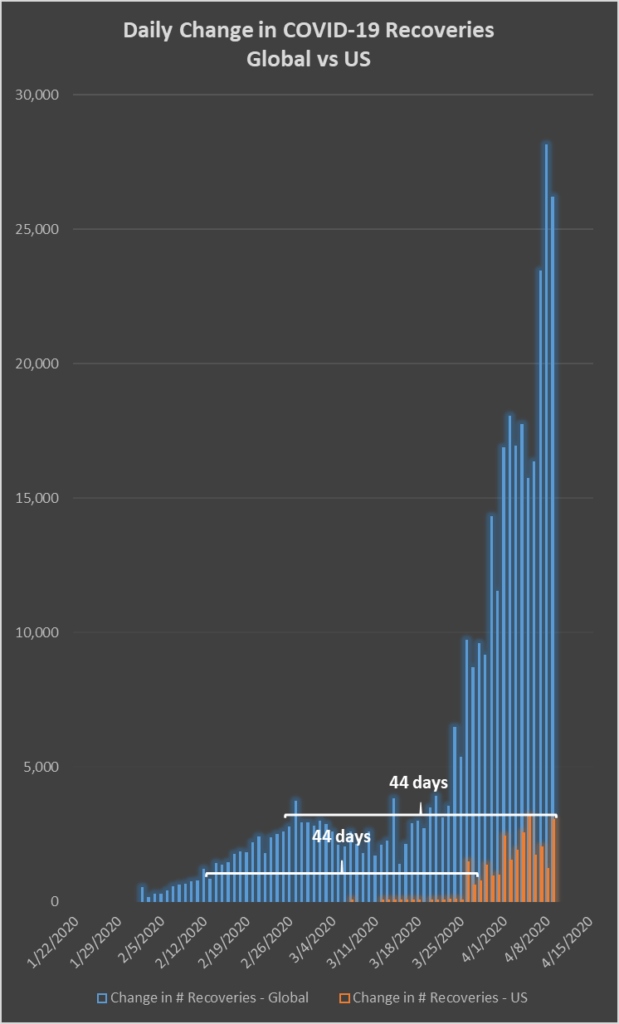
Global Recoveries: up 7.9 percent, or 26,174, to 356,440.
US Recoveries: up 13.3 percent, or 3,035, to 25,925.
The United States appears to be trailing the world by 44 days.
Global Unresolved: up 4.75 percent, or 52,160, to 1,151,275 cases currently sick with COVID-19 globally.
US Unresolved: up 7.2 percent, or 28,700, to 425,950 cases currently sick with COVID-19 in the United States.
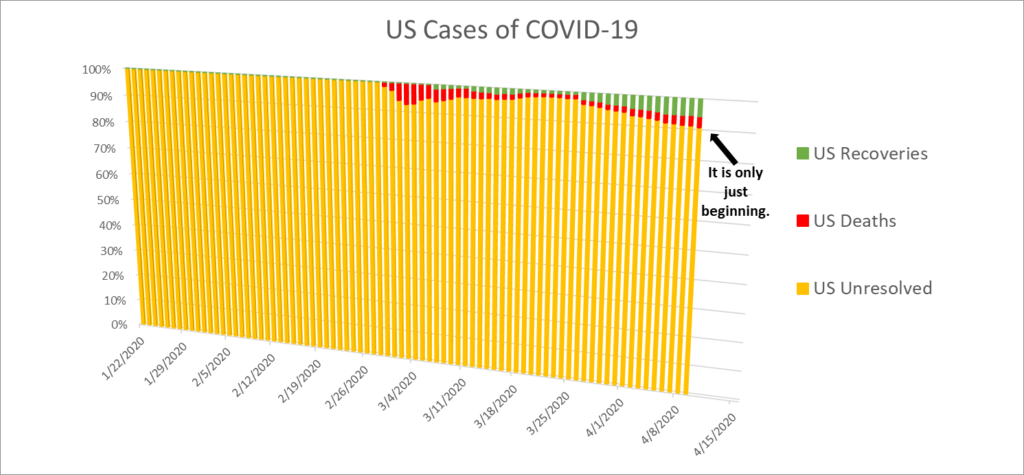
As usual, I close with the daily update of my projections from March 18, and with the charts showing the proportion of Unresolved, Recoveries, and Deaths both globally and in the United States.
