March 24, 2020, 5:30 pm
I had to take a break last night. I was on my tenth day of focusing on this, and I just had to step away. Here’s what I would have put out last night, with numbers as they stood as of about 11 pm:
Global Cases: Up 12.3 percent, or 41,500 (I’m going to start rounding the numbers, for ease of consumption by the reader), to 380,000.
Global Deaths: Up 13 percent, or 1,900, to 16,500.
Global Recoveries: Up 3.6 percent, or 3,500, to 102,500 recoveries.
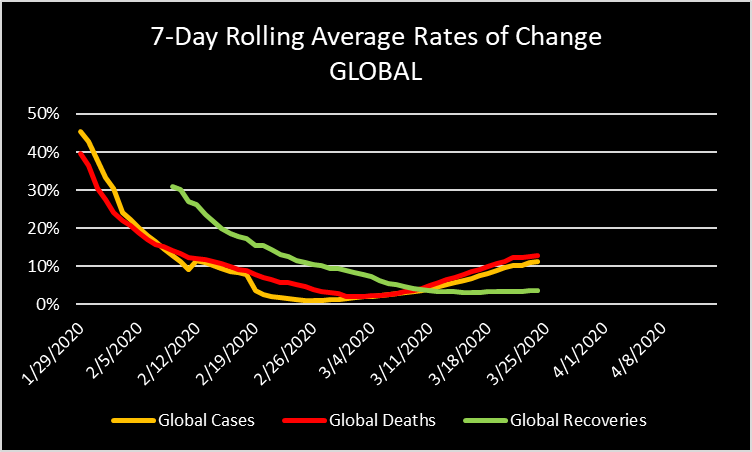
I’ve begun to calculate the 7-day rolling average of the growth rates, in order to provide a better idea of where we are on the various curves: Cases, Deaths, and Recoveries.

We can see a couple of things from this. One is that, in the beginning, the rates of change are very high (for reasons I’ve already described in past posts). As I’ve pointed out, a change from 2 cases to 4 cases is a change of 100 percent. As the number of cases increases, the relative rates of change should decrease, since the number of cases, deaths, and recoveries are not doubling every single day. It is not a perfect exponential curve with a doubling rate equal to 1 day.
As the number of cases gets into the thousands, tens of thousands, and now hundreds of thousands, a daily 7-day rolling average growth rate in the range of 20 percent or higher should terrify anyone. This was the range globally from January 29 to February 5; From February 5 to February 14, the rate was between 19 percent and 10 percent. And from February 15 to February 25, that rate decreased to a low of 1.04 percent.
From that date on, the rate has been increasing, and it currently stands at 11.3 percent.
We can see that the rate of change in Deaths has matched the rate in Cases almost exactly, but the rate of change in Recoveries follows the same shape, only with a lag of about one week. This makes sense, because, presumably, it takes longer for a patient to recover from the virus than it takes to die from it.
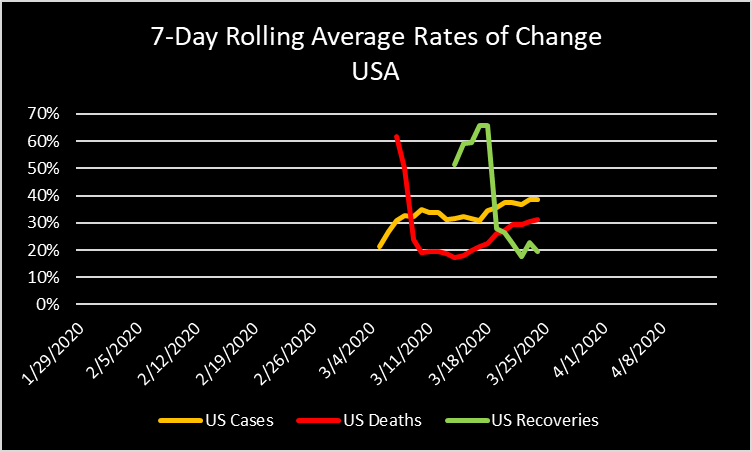
The data for the US:
US Cases: up 35.2 percent, or 11,800, to 45,350.
US Deaths: up 40 percent, or 166, to 585.
US Recoveries: up 66 percent, or 117, to 295. (I think this is a data error, because the number of recoveries registered for the previous day was only 2, making 117 new recoveries appear like a huge jump. If we split those 117 new recoveries into thirds, and give one third of them to yesterday’s number, and keep two thirds of them for today, it looks more like 37 percent.)

Looking at the rolling 7-day average rates of change in the US, we see the same pattern: an unrealistically high percent rates of change in Deaths and Recoveries at the beginning of the curves (around 60 percent), due to the low absolute numbers of cases, followed by a leveling of those rates at around 20 percent for Deaths and Recoveries and around 30 percent for Cases.
A daily growth rate of 20 percent is frighteningly high. If we take today’s number of Deaths (565) and apply a daily growth rate of 20 percent, then after 30 days we will have 111,765 Deaths. If that rate persisted for another 30 days, the total would reach 26.5 million. Deaths.
We could apply a different model, based roughly on the global data. (I should note again, that the global data I’ve been working with includes the US data, but two weeks ago the US portion of the global data was relatively insignificant, whereas now it represents a significant proportion of that data set. I’m not obsessive-compulsive enough to go back and change all of my data and models to segregate those data sets at this point. My whole purpose in doing this twelve days ago was just to try to get people to take this seriously and stay home.)
If we assign a 20 percent rate of growth for the first seven days, and then gradually reduce that growth rate by 1 percent per day, and then increase again by 1 percent each day for the next 30 days, then we would get the following projection: 2,843 deaths 10 days from now; 13,340 deaths 30 days from today, and 1.8 million deaths 60 days from now.
Epidemiologically speaking, I have no idea if this is a realistic or valid way of structuring a projection. But that’s what it would be.
With respect to my original projection from March 14, I’ve been filling in the data each day as it comes in. The original projection was based on a doubling rate of 6 days. In fact, the rate has been closer to doubling every 3 days. This is very bad.
