January 13, 2021
#stayhomebewell
Oh, and by the way. I forgot to mention that I can pretty confidently tell you how many people are going to die now on any given day. There is a reliable forty-day lag time from the time a new case is logged to the time a new death is recorded.
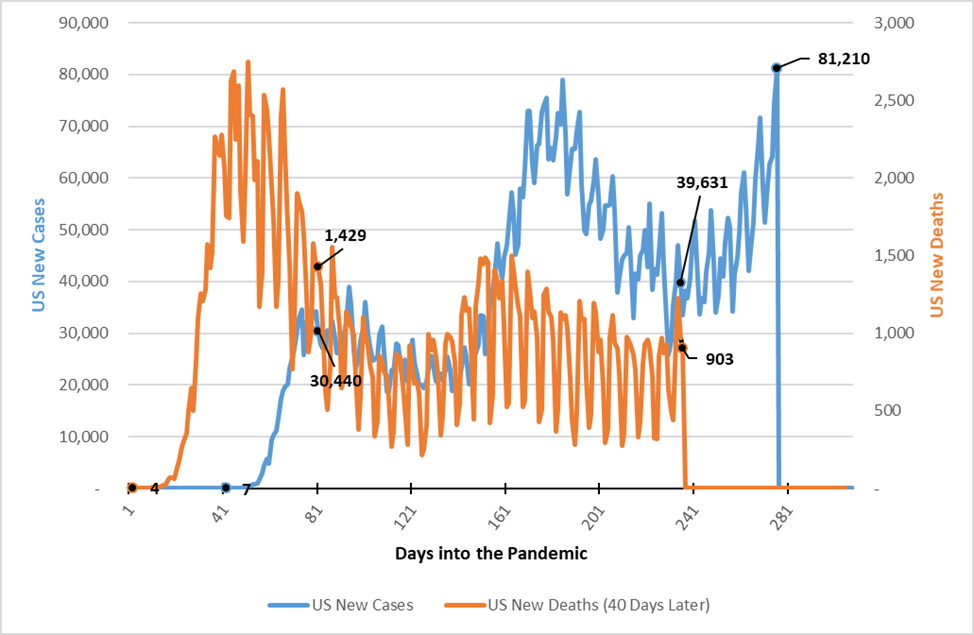
On October 24, 2020 (https://stayhomebewell.org/2020-10-24/), I posted this graph:

This shows New Cases in blue, trailed by New Deaths in orange. On New Case day 240, there were 39,631 new cases. Forty days later, on New Death day 240, there were 903 deaths. This produced a Case Fatality Rate (CFR) of 2.3 percent. You can see that, on New Case day 280, there were 81,210 new cases. We had to wait forty days to find out how many of them would die. That would be on December 2.
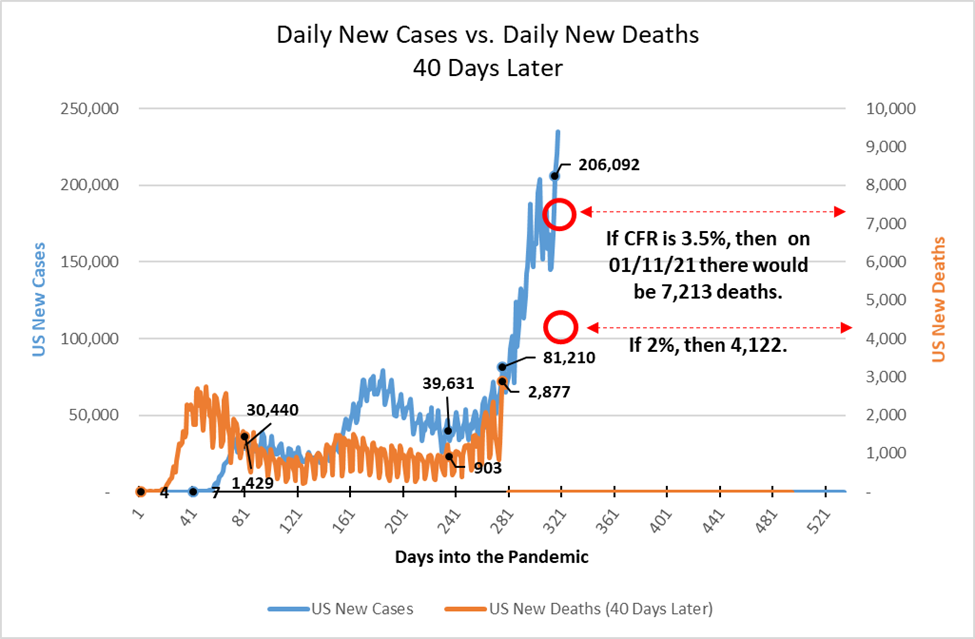
On December 5 (https://stayhomebewell.org/2020-12-05/), I posted the following graph:

This showed that, in the event, there were 2,877 deaths on New Death day 280. This yielded a CFR of 3.5 percent. By that time, we were already at New Case day 320, and there were 206,092 new cases. I predicted that, if the CFR were to be 2 percent, then we would see 4,122 deaths forty days later, and if the CFR were 3.5 percent, then we would see 7,213 deaths. Forty days later was January 8.
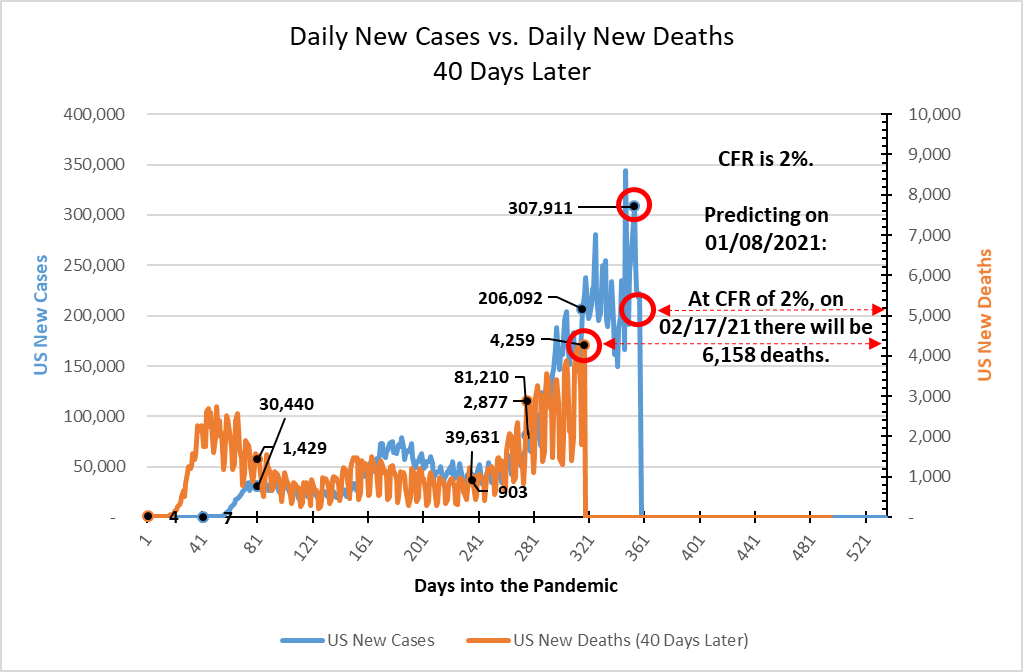
Here’s the chart:

There were 4,259 deaths on January 8, 2021. The CFR was 2 percent. At that rate, on February 17, 2021, there will be 6,158 deaths in the United States attributed to COVID-19.
I can do this for every single day. So can you. Take the number of new cases you see on the bottom or the side of your TV screen as you watch the news and multiply it by two percent. That will be a very close predictor of the number of dead you will see reported forty days later.
It is not complicated. I wish it were.
