November 8, 2020
#stayhomebewell
For those of you who have been following this blog for any period of time, none of what I’m about to write should come as a surprise. For anyone who is reading me for the first time, I recommend going back through some of the archival posts in order to get up to speed. Everything that I was focused on for most of the late spring and into the summer is coming to pass. Now. Right now.
The thing I’ve been focusing on most has been growth rates. This is where I feel the news coverage has failed. Each day they talk about the new case numbers, but they don’t go just one level deeper, which is where the real insight is.
I’ve discussed this and have embedded links to previous posts where I discussed this in the past, but I doubt many people follow them or bother to read what I was writing in April, May, June, etc. So I’ll briefly describe it again now.
A change from 1 to 2 is a growth rate of 100 percent. A change from 2 to 3 is a growth rate of 50 percent. And a change from 3 to 4 is a growth rate of 33 percent. The absolute change in each case is 1; but the rate of growth decreases as the base number increases.
Hence, a change from 100 to 110 is a growth rate of 10 percent, and an absolute change of 10. A change from 1,000,000 to 1,010,000 is a growth rate of 1 percent, but an absolute change of 10,000. As the base number gets bigger, even what would appear to be very small changes in the growth rate translate into huge changes in absolute numbers.
Here is a chart I published on April 21 (https://stayhomebewell.org/2020-04-21/).
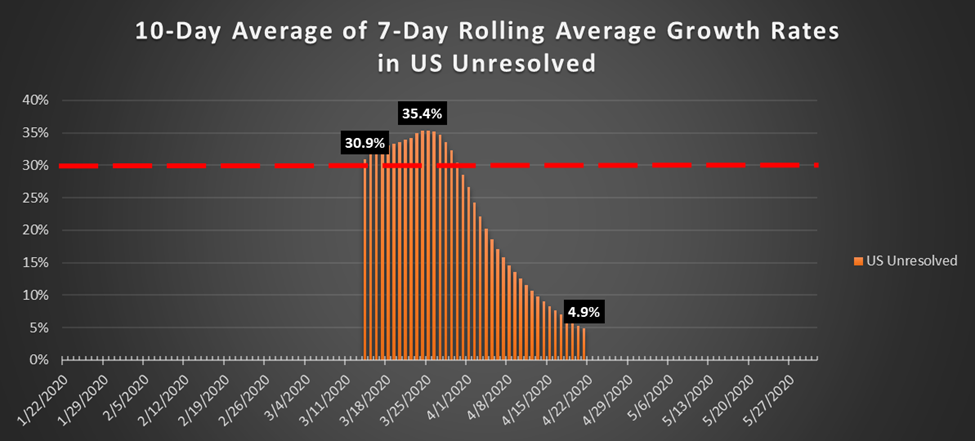
I’ve also explained that “Unresolved” = Total Cases – (Recoveries + Deaths).
There are only two outcomes when someone is infected with COVID-19: they recover, or they die. After infection, the course of illness can run anywhere from, essentially, zero days (no symptoms) to roughly 40 days. (Of course, there are people who are sick for much longer while actively infected, and there are others who suffer from long-lasting consequences but who are no longer actively infected, the so-called “long-haulers.)
However, the people who were infected in March have either recovered or they’ve died. Roughly 97 percent recover, and 3 percent die, by all accounts.
On June 24, I explained why the number of Unresolved cases is the important metric (https://stayhomebewell.org/2020-06-24/), and therefore why the growth rate in the number of Unresolved cases is the key to what happens in the pandemic. If, for the sake of illustration, there are 1,000,000 Unresolved cases in the country on a given day, then we can assume that there will be roughly 200,000 patients (20 percent) who will require hospitalization. Of those 200,000, roughly 20 percent, or 40,000, will require space in an Intensive Care Unit (ICU) with a ventilator. And of those 40,000, roughly 20 percent (8,000), will die. Eight thousand out of a million is 0.8 percent.
How many of them will die on a given day is unknown, but the United States has recorded an average of 888 deaths per day over the last 180 days.
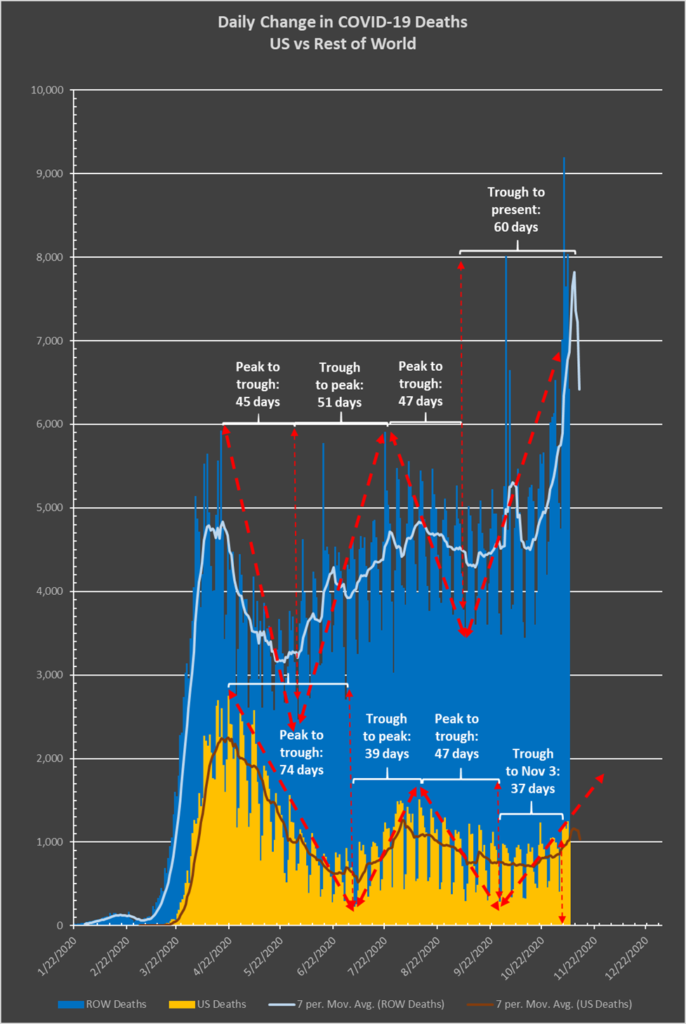
Now, if, on a given day, there are 50,000 new infections but there are 59,000 recoveries and 1,000 deaths, then the number of Unresolved cases on that day will decrease by 10,000. As long as Recoveries + Deaths is greater than the number of new Cases (R + D > C), then the number of Unresolved cases, and, thus, the potential strain on the nation’s hospital system, will go down.
However, this has almost never been the case.
There is wide fluctuation in the daily reporting numbers of new infections (Cases), Deaths, and Recoveries. Sundays are almost always the lowest, followed by increasing numbers for the week, such that there are usually peaks on Fridays or Saturdays, and valleys on Sundays or Mondays. To account for this, we look at rolling averages, typically seven-day rolling averages.
Here is a graph showing the daily numbers of new infections, or Cases, in the United States (yellow), superimposed against the same measure in the Rest of the World (ROW, in blue). The average number of new Cases in the United States over the last 180 days has been slightly under 50,000. The average in the last 30 days has been 78,000 per day.
If the next 20 days continue the trend of the last 60 days, then we may see 150,000 new Cases per day by Thanksgiving.
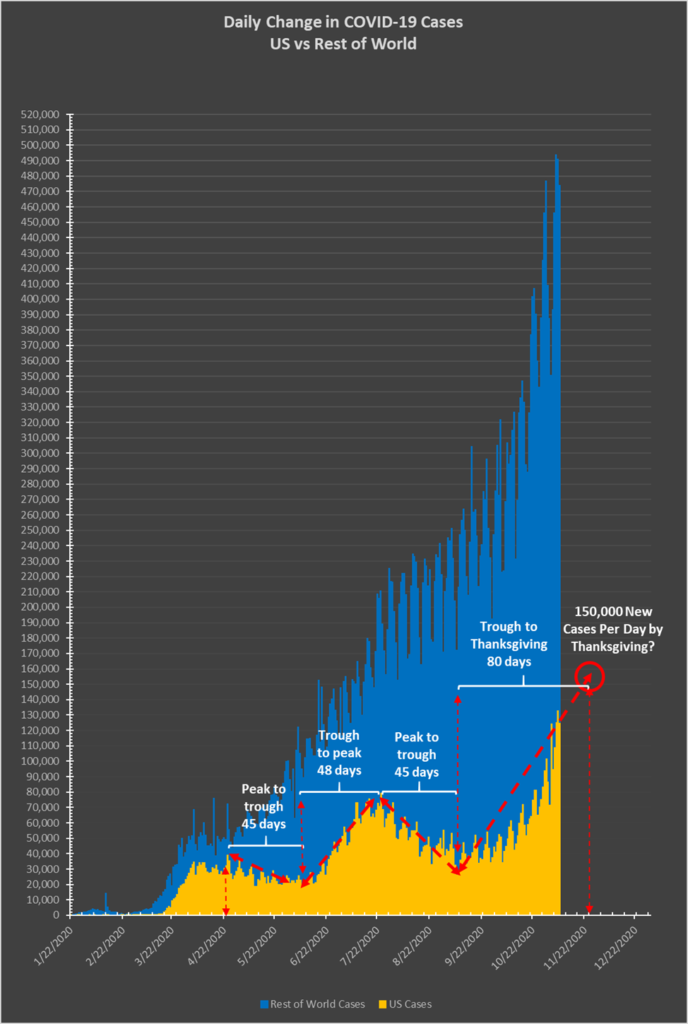
(You can see that there is a regularity to the little peaks and troughs, and those illustrate the weekly cyclic characteristic of the reporting of statistics.)
Now, this graph by itself does not tell the story that needs telling. What if the numbers of Recoveries are outpacing the numbers of new Cases? Then that would actually be a story of an improving situation, right? Right.
Well, you can see in the chart below, that the average daily number of recoveries has been around 35,000 for the last 180 days, and 47,000 for the last 30 days. The increasing number of Recoveries might have something to do with improvements in medical care for infected patients. Or, it might just reflect a larger pool of infections. If the recovery rate stays steady at around 97 percent, then of course there would be more Recoveries from a population of millions of infected patients than there would be from a pool that measures only in the thousands.
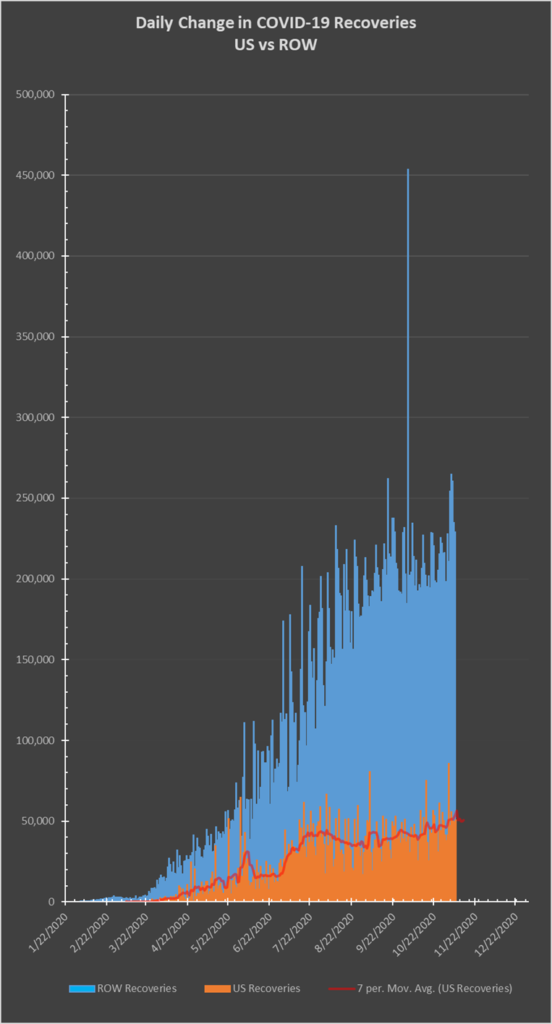
Well, here is where the rubber meets the road. How many people in the United States are infected with COVID-19 on any given day? The chart below answers this question.
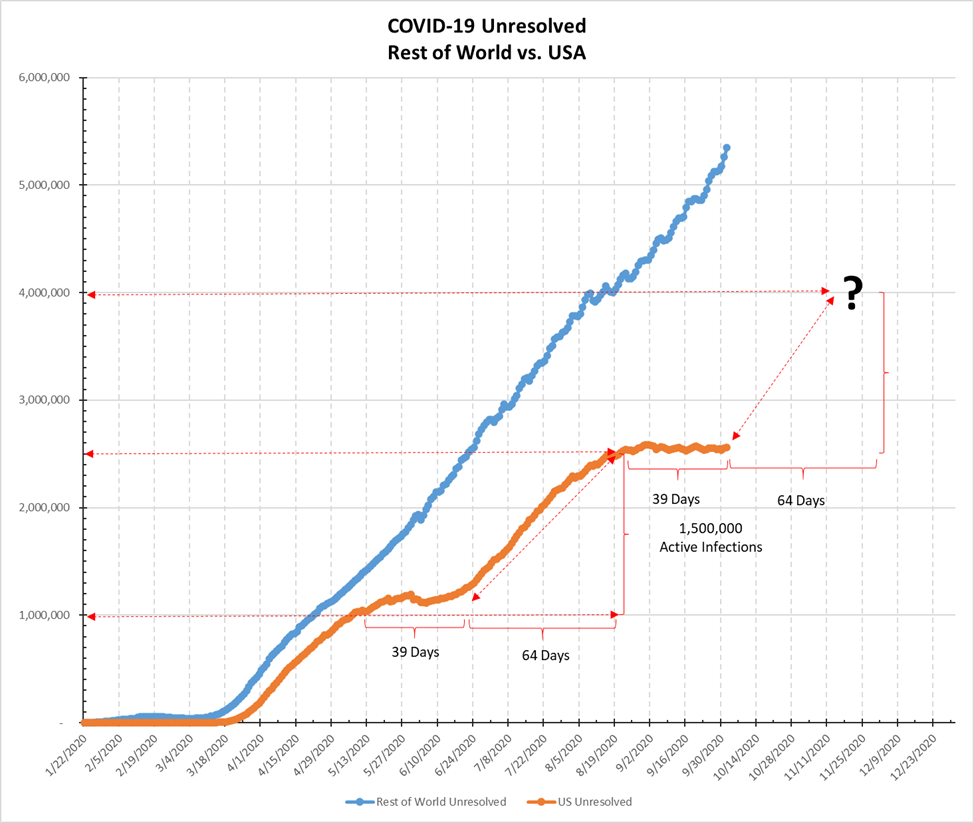
Here is the graph I published on October 3 (https://stayhomebewell.org/2020-10-03/), in which I foretold what is happening now:
Here is what that graph looks like today:
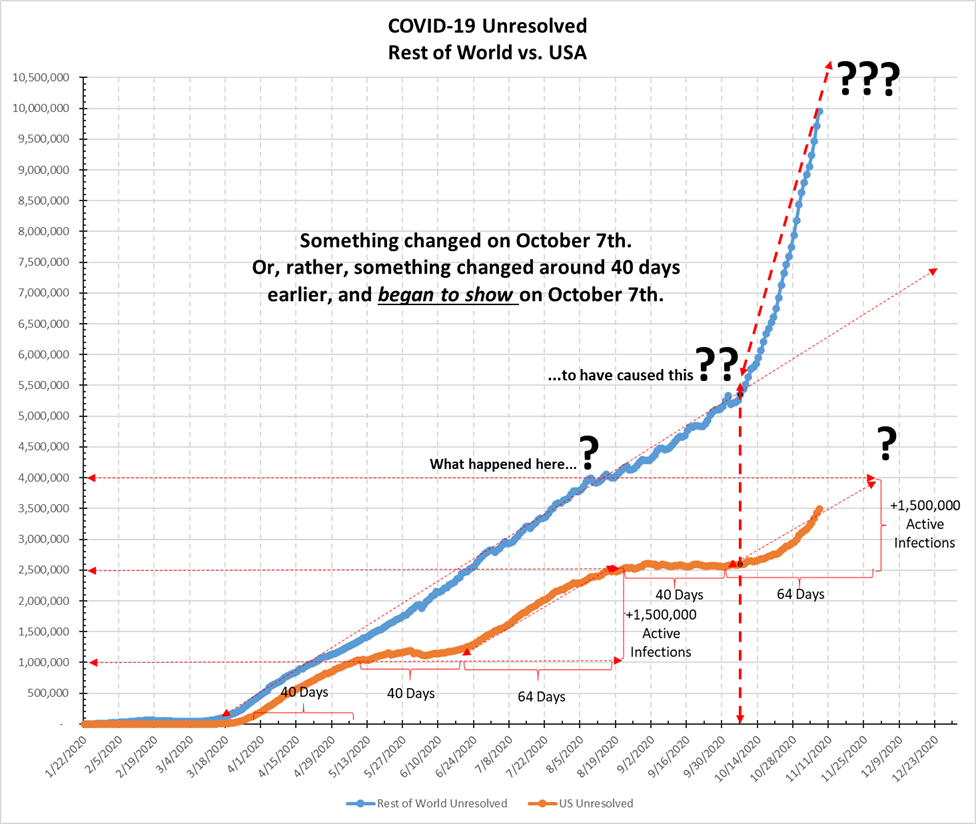
There’s a lot to unpack in this graph.
First, the blue line represents the number of Unresolved cases in the Rest of the World, and the orange line represents the United States.
Because the scale of the graph is in the millions, the early days of the pandemic all look like they are on the zero line. However, by March 29th, the numbers in the United States leapt out of the flat portion of the exponential growth curve, and over the 40-day period from March 29th to May 8th, we went from having roughly 100,000 to 1,000,000 Unresolved infections.
For the next 40 days, that number held steady at just above 1,000,000. However, for a period of roughly 64 days after that, from roughly June 19th to August 20th, the number again rose, this time by 1,500,000, to hover for another 40 days at a level of 2,500,000 Unresolved infections every single day. Some people recovered, some people died, and new people contracted the virus, but the growth rate remained near zero percent.
From approximately October 7th, the next phase of growth began, and now we are seeing a frightening increase in Unresolved cases that will soon approach and exceed the level of 4,000,000. Four million people infected with COVID-19 in the United States at the same time.
Look at the blue line, representing the number of Unresolved cases everywhere in the world outside of the United States. You can see that from roughly March 18th, the growth remained consistent, tracking a straight line upward slope through to October 7th. However, from October 7th, the slope of the line makes a drastic upward shift, becoming nearly vertical for the last 30 days.
This begs the question: What happened on October 7th to cause this change?
However, perhaps that is the wrong question. Perhaps the right question is: What happened roughly 40 days prior to October 7th, to have caused this change?
Well. It just so happens that the five days from August 20th-24th marked the bottom of the trough in the growth rate curve of Unresolved cases worldwide.
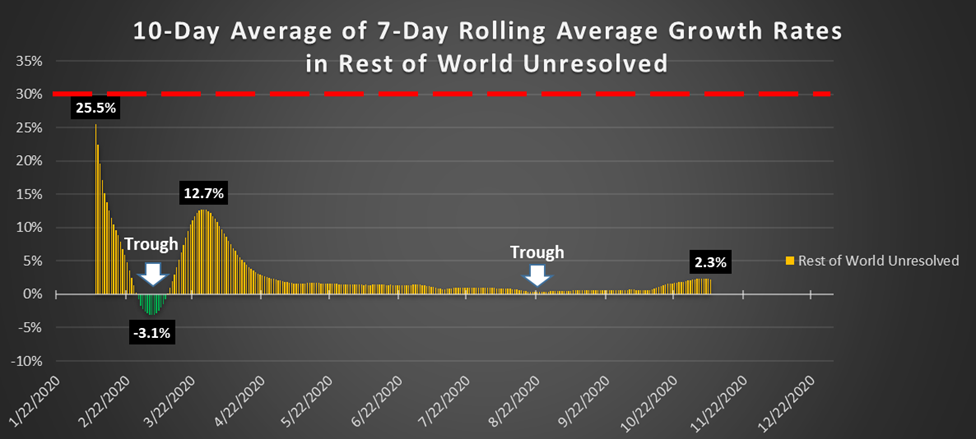
The first trough occurred in early March, when the number of Unresolved actually decreased for a period of 14 days, before rising again to peak at 12.7 percent on March 26th.
Remember, that a slowing growth rate is still growth! So, even though the chart above appears at first glance to show something decreasing, it is merely the rate of growth that is slowing, while the absolute number of actively infected Cases was growing from a low point of 38,000 on March 4th to more than FOUR MILLION on August 20th.
But it never went back into negative growth. The bottom of the Rest of World trough was a positive 0.3 percent for those five days. That means that it kept growing, just at the slowest rate since March. Once that trough bottomed out, though, the growth began to accelerate, like the snowball rolling down the mountain. The growth rate now stands at 2.3 percent, and the total number of Unresolved cases in the rest of the world is 9.9 million. And 2.3 percent of 9.9 million is nearly 230,000 additional Unresolved infections. PER. DAY.
In the United States, the situation is virtually analogous, if a couple of weeks delayed.
Remember the chart at the beginning of this post? The one from April 21st? Here’s what it looks like today:
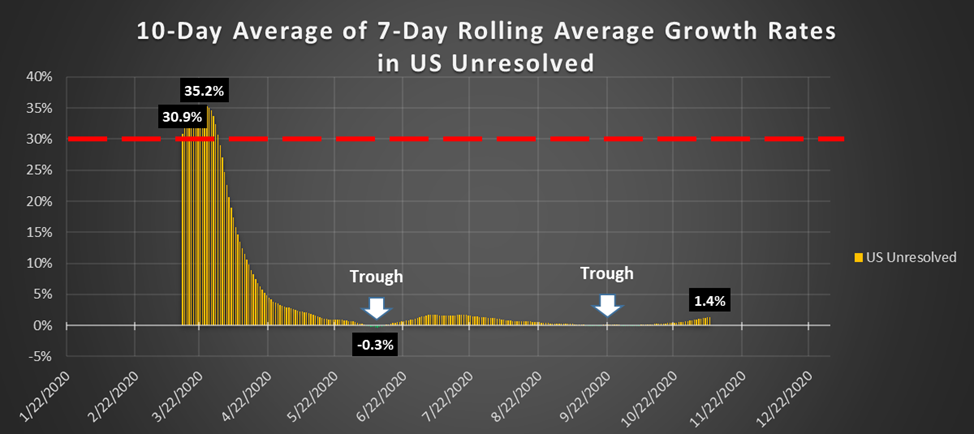
We had the first trough in June, which saw eight whole days of negative growth. After June 14th, the rate again grew, but peaked for 18 days at a level of 1.6 percent. From July 21st, the growth again slowed, bottoming with five days of -0.1 percent growth (or, a tiny decrease in the number of Unresolved infections for five days, then holding at zero percent growth until (you guessed it!) October 7th. From October 7th to the time of this writing (November 8th), the rate of growth has increased to its current level of 1.4 percent.
There are currently just under 3,500,000 Unresolved cases in the United States. And while the rounded number of new Cases was 124,000 yesterday, the number of Deaths was 1,000 and there were 50,000 Recoveries. 124,000 – (1,000 + 50,000) = 73,000.
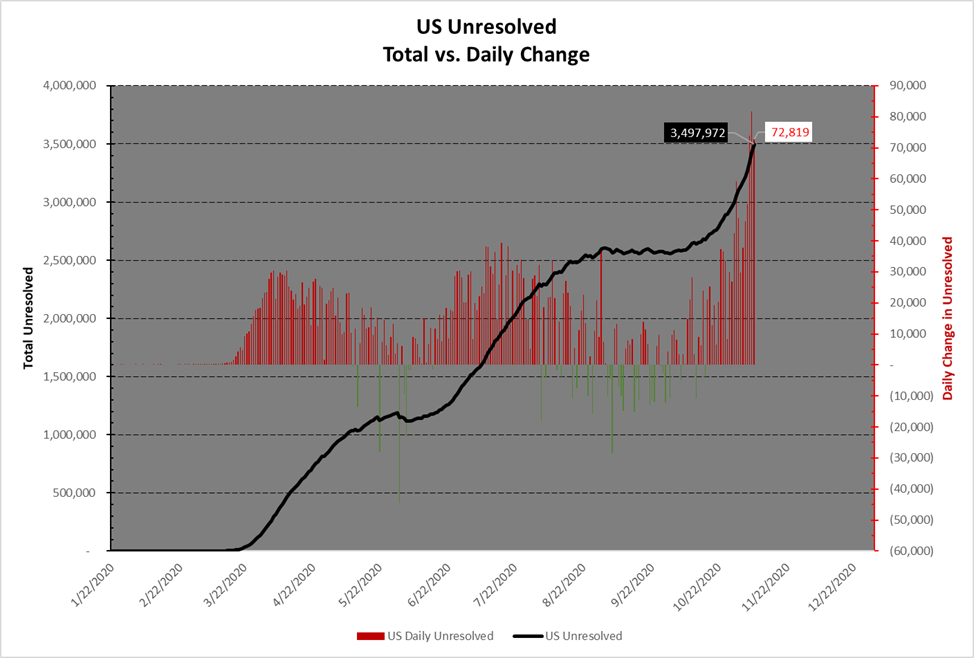
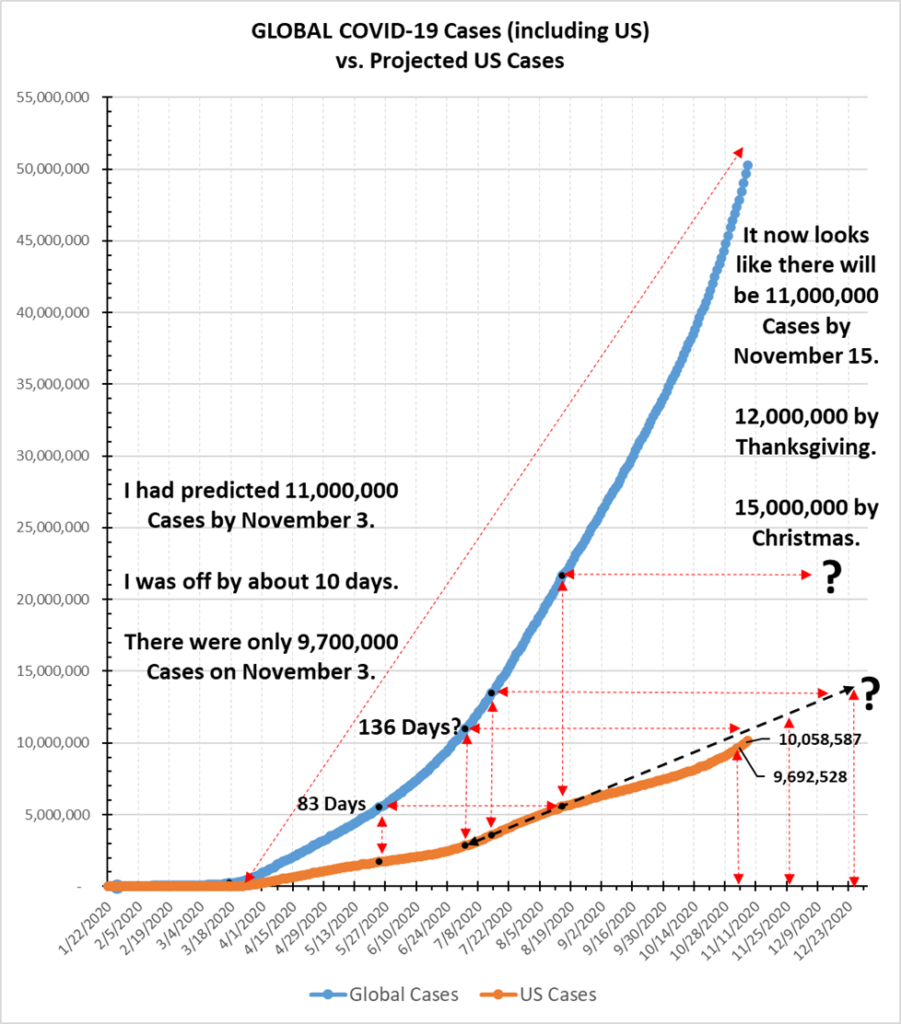
So. Here is where I see things going:
Cases:
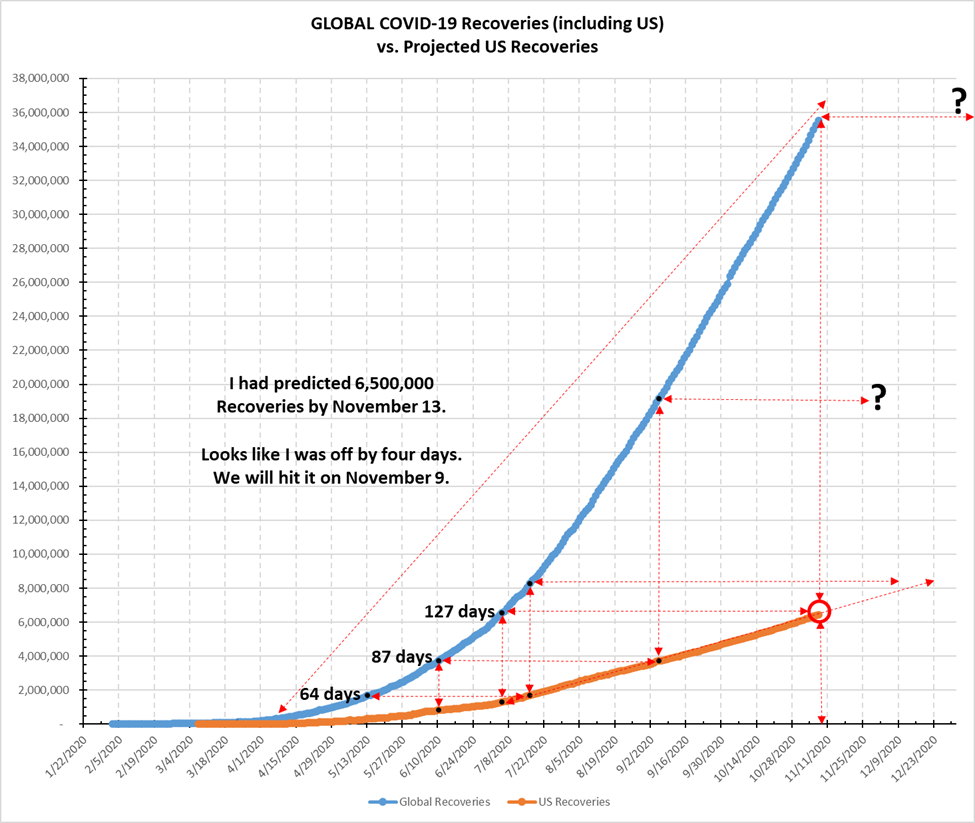
Recoveries:
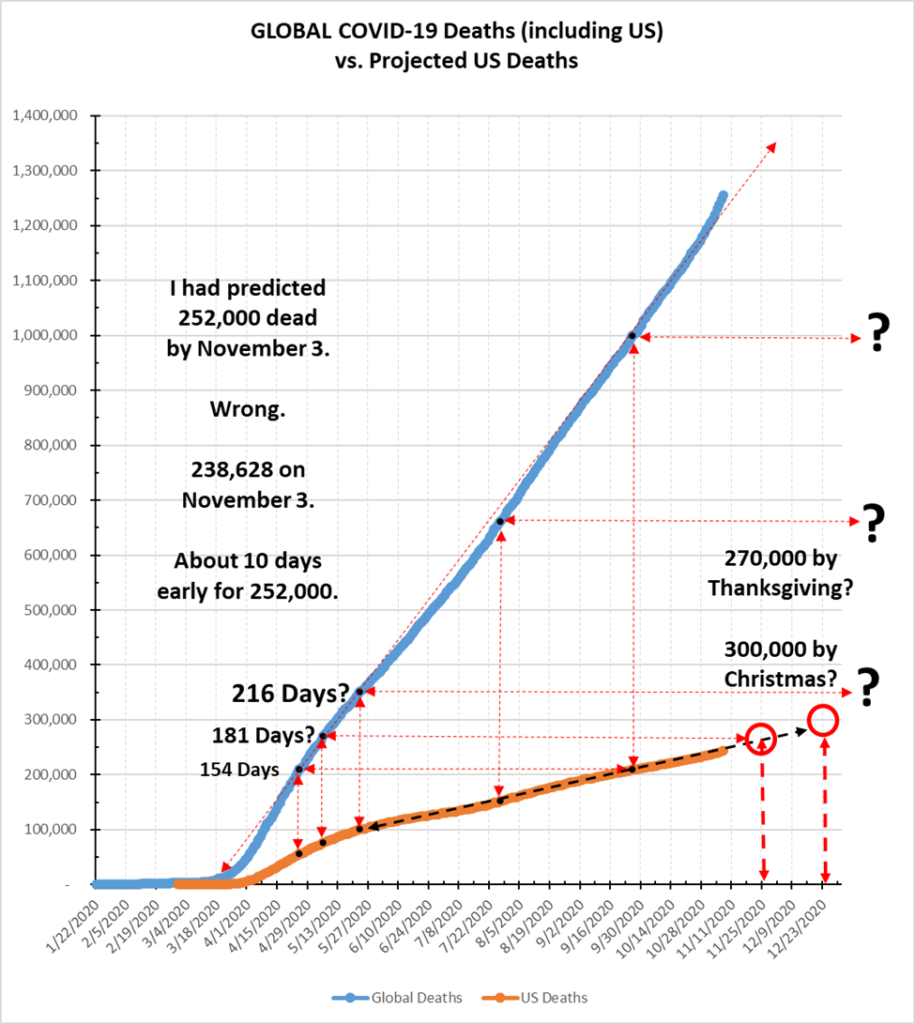
Deaths:
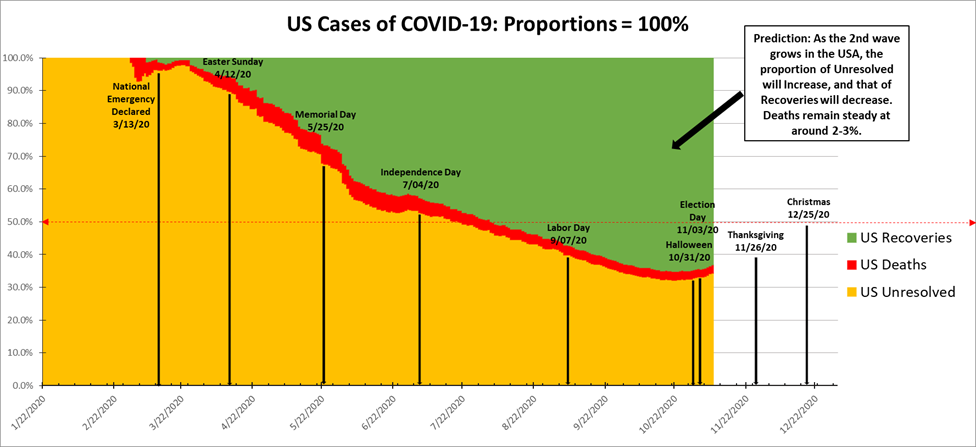
Here is the chart showing the proportions of Unresolved, Deaths, and Recoveries that I’ve been following for about seven months:
Here’s a view of the same data, only in absolute values:

There’s no time left. People have to stop transmitting this virus to one another. I predict that strict lockdowns are inevitable, and that the idiots will take up arms.
One reply on “November 08, 2020”
[…] Look at my posts from October 3 (https://stayhomebewell.org/2020-10-03/) and November 8 (https://stayhomebewell.org/2020-11-08/) to see what I had […]