October 3, 2020
#stayhomebewell
I’m posting less and less frequently. Back on July 26th I described this pandemic as just growing larger and larger, such that the need for frequent updates was diminishing. I may just stop posting altogether soon, except for when there is some significant milestone. The world excluding the United States has just reached one, and I believe the same one is approaching soon for the United States, so this will be my heads-up to you all about it, and I’ll post again when it actually tips.
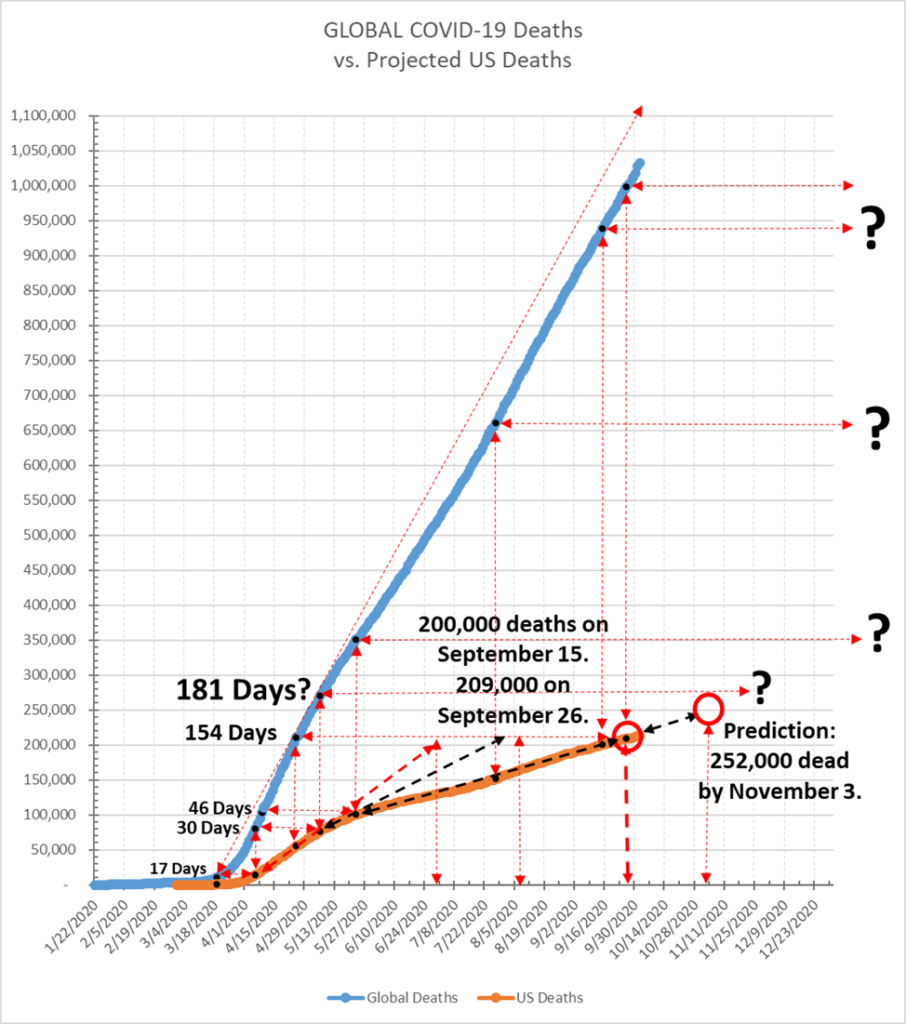
First of all, let’s talk about having reached 200,000 deaths. On that same July 26th post, (https://stayhomebewell.org/2020-07-26/), I projected that we would reach this milestone by September 13. I was off by two days. It was September 15, eighteen days ago.
Using my triangulation method, my next milestone number after 100,000 was actually 209,000, which we reached on September 26, seven days ago.
Today we are at 214,000 at time of writing.
On August 10, I projected that we would reach 252,000 dead by Election Day, November 3, 2020 (https://stayhomebewell.org/august-10-2020/). Here is what it looks like now:
OK, so enough with the chest-thumping about how ON THE FREAKING NOSE my predictions have been.
The point of today’s post is the metric of the proportions of Unresolved, Dead, and Recovered cases globally (the Rest of World, excluding the United States) and in the United States.
I’ve explained this graph at length in previous posts, including links to the relevant archival posts on https://stayhomebewell.org/2020-07-26/ so please refer to the archives and find the explanations if you don’t already understand what this graph is telling you.
As the pandemic moves across the physical geography of the globe, it is reflected in this chart as the undulations of the waves in the measurements of the proportions of those who have recovered from COVID-19 and those who are currently, actively ill (be that asymptomatic, mild, severe, or critical).

In the beginning, 100 percent of cases are Unresolved. Gradually, some recover and some die. After the first 38 days of the pandemic, from January to February, the number of Recoveries exceeded 50 percent of all Cases. That proportion peaked at 57 percent on March 8th, while the proportion of Unresolved, or Active infections, bottomed at 40 percent, while Deaths accounted for 3 percent of all cases. Then the proportion of Recoveries began to decline and Unresolved began to increase, with Recoveries bottoming at 21 percent from March 28th to April 7th, while Unresolved peaked at 74 percent over the same period. Deaths had grown to 6 percent. The wave in these proportions continued for 80 days, at which point Recoveries once again exceeded Unresolved, on June 2nd.
I can’t help but be struck by the frequency with which the numbers that stand out bear some relation to the number 40. I discussed on July 26th and on August 15th the significance of that number, but it seems to coincide with the length of the average COVID-19 course of infection. But note here that the first period was 38 days (almost 40); the third period was 80 days (2 x 40); and the current period is 123 days (3 x 41).
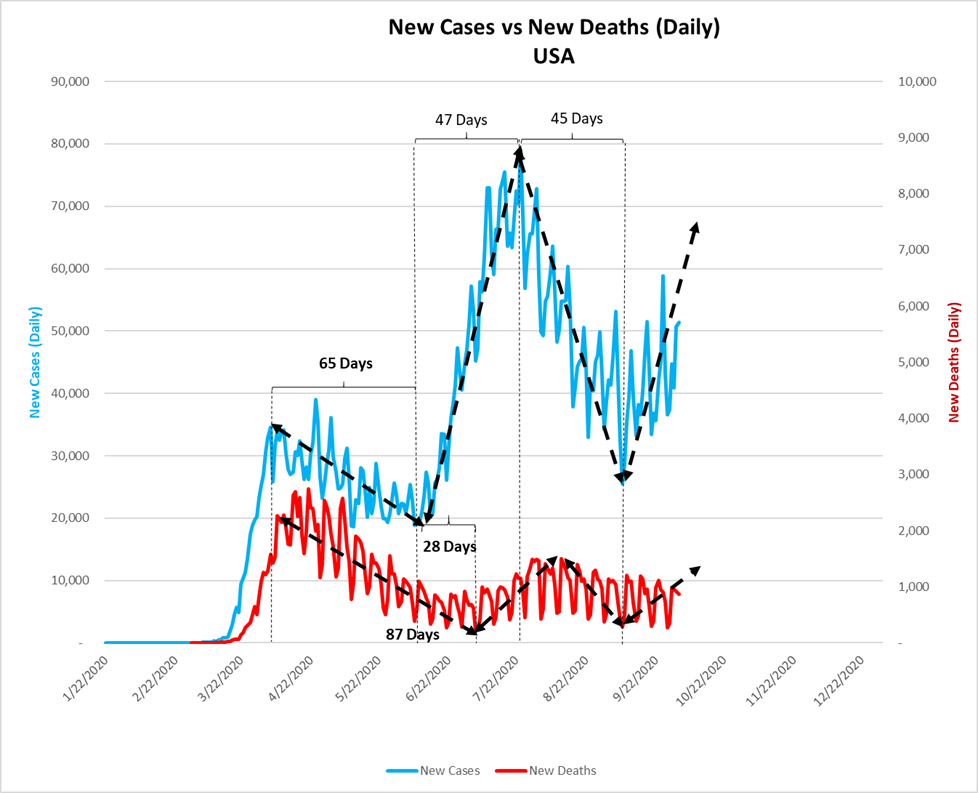
It has been 123 days since that time, and the proportion of Recoveries appears to be forming a top once again, at 74 percent. I suppose it is possible that Unresolved infections will continue to decline globally and Recoveries will increase, but I’m going to guess that they will not. Back on April 9th (https://stayhomebewell.org/2020-04-09/), I wrote, “Since the epicenter shifted to the United States, cases, deaths, and recoveries in this country have represented a greater and greater portion of the global numbers. Once the numbers of infections start to grow exponentially in the major population centers of Brazil, Africa, India, and other countries, the US numbers will be eclipsed and will represent a diminishing portion of the global figures.” Well, on July 24, the number of new cases per day peaked at 78,000, while the average since that time has been 47,000 new cases per day. By contrast, on July 24, India recorded 49,000 new cases, and that country’s numbers have been rising, peaking at 97,000 new cases on September 11. I don’t have the daily data in spreadsheet form, but just eyeballing the graph, it looks like India’s average for daily new infections since the end of July is around 75,000 per day. India is currently in second place for total infections, at 6.5 million, after America’s 7.5 million.
If the daily increases in the two countries were to continue with the USA averaging 50,000 new cases per day and India averaging 75,000 new cases per day, India would reach parity with the United States after 41 days, or on November 13. I’ll mark my calendar to check on when India takes the ignominious number one spot.
The United States’ portion of global Unresolved cases peaked at 44 percent from May 1st to May 9th, after which it fell to only 33 percent on June 19 (41 days). It rose again and held at 38 percent from July 21st to September 1st (43 days) and has been declining since that date. Currently, the US accounts for 32 percent of all Active cases in the world.
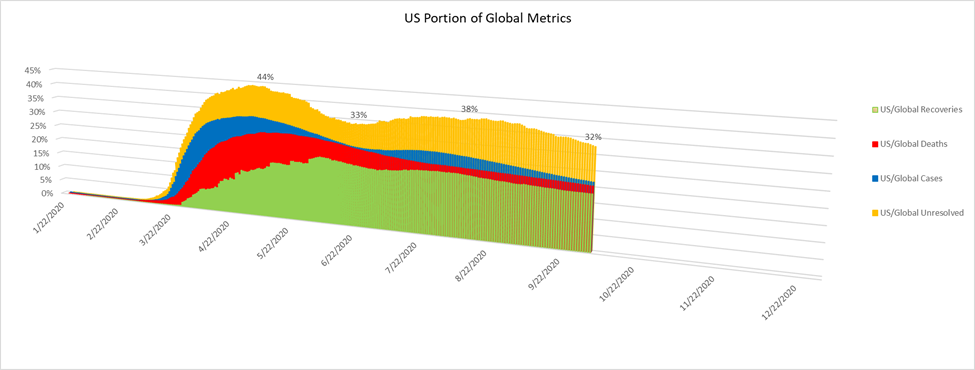
Disturbingly, the US portion of global deaths has remained consistent at just above 20 percent for months. Four percent of the world’s population; the “BEST” health care system in the world; but 20 percent of COVID-19 deaths.
Alright. When you remove the United States from the totals and look just at the rest of the world, the proportion of Recoveries appears to have just formed a peak at 78 percent as of three days ago. I fear that this signals the coming of an increasing proportion of active, Unresolved, infections that will persist for months.
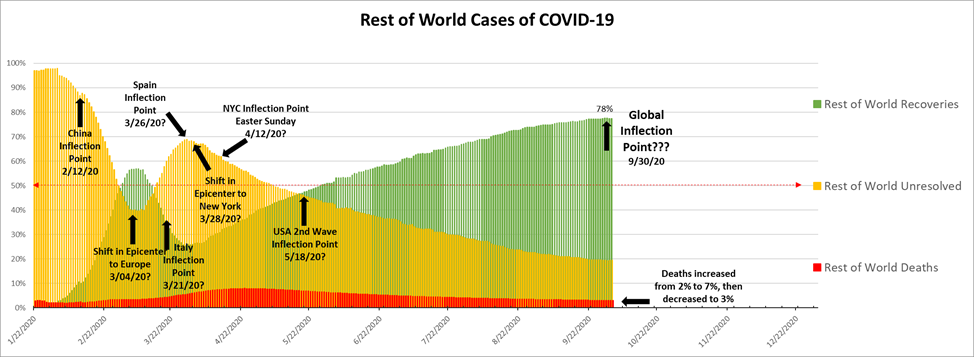
As in the spring, the reason this is of concern is due to the potential for overwhelming the world’s hospital systems’ capacity to handle thousands, or tens of thousands, of critical cases.
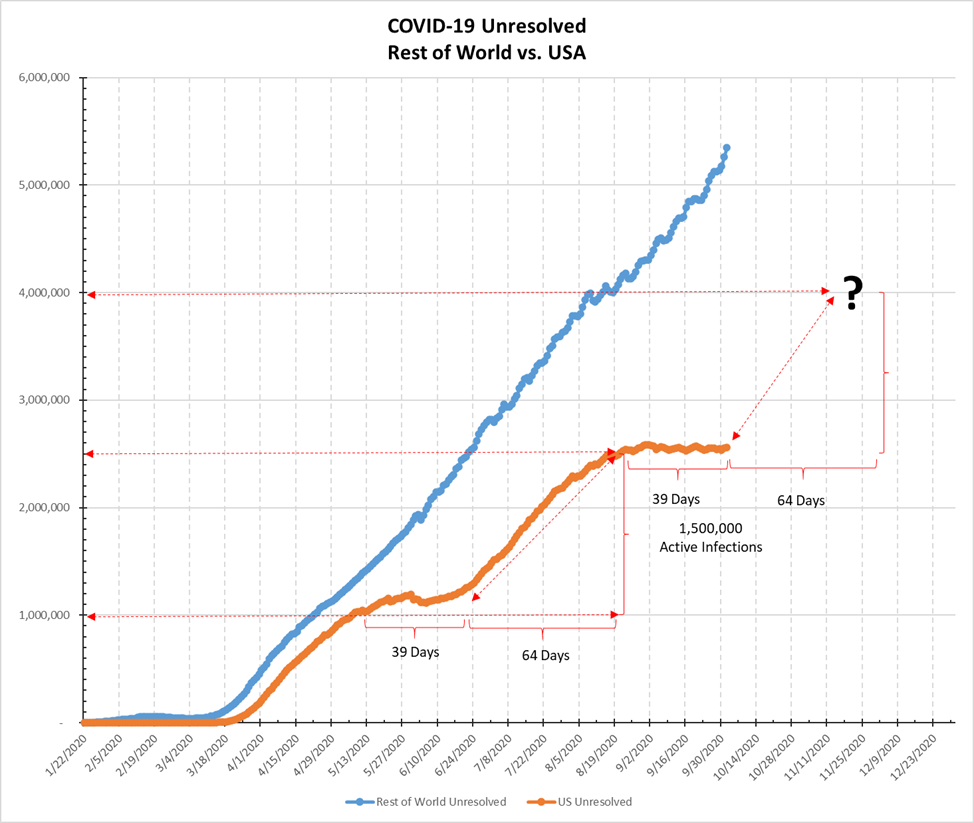
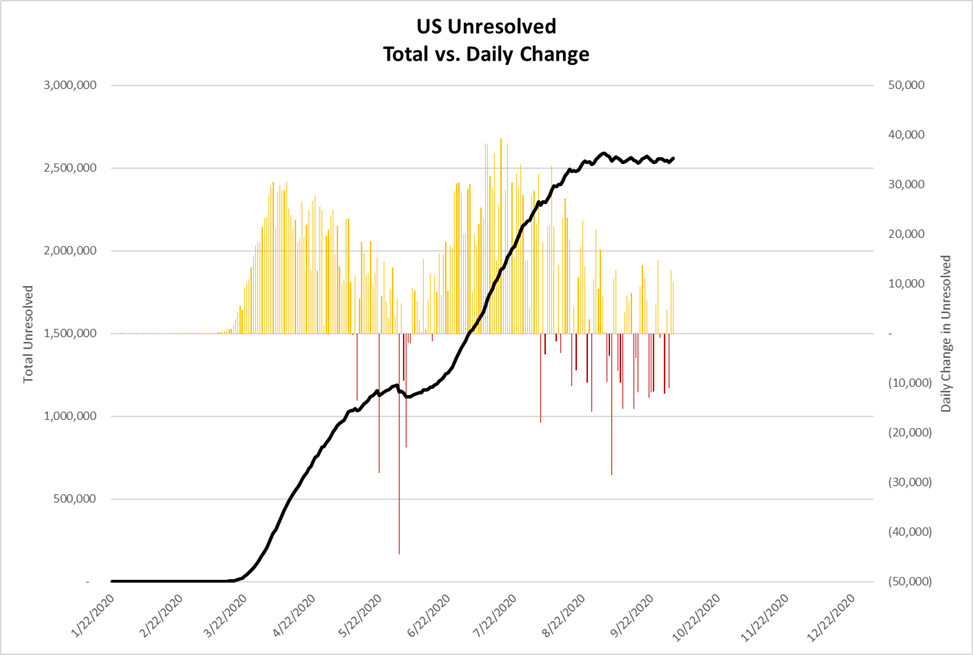
In the United States, the peak appears to be forming, but has not inflected yet. When it does, hospitals may be overwhelmed. Recall that we were concerned when the total number of cases in the US was less than one million. We currently have 2,500,000 active cases, which have been at a plateau for around six weeks (39 days). When and if the US hits that inflection point, I expect the number of Unresolved cases to increase for several months.
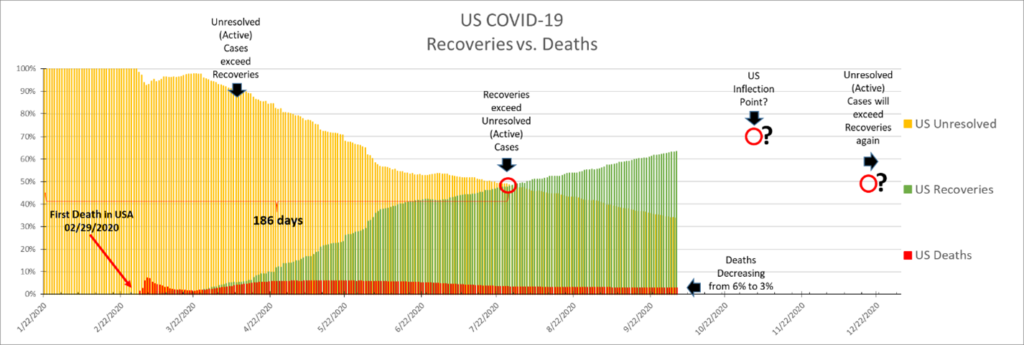
This would happen to coincide with the traditional winter flu season in the United States. Over the next two months, if the past is a predictor of the future, the number of Unresolved cases may increase to a level of 4,000,000. (Note the two periods of 39 days in the graph below.)
That’s what I wanted to alert you to. I’m just about finished with this. The thing that is keeping me going now is just intellectual curiosity.
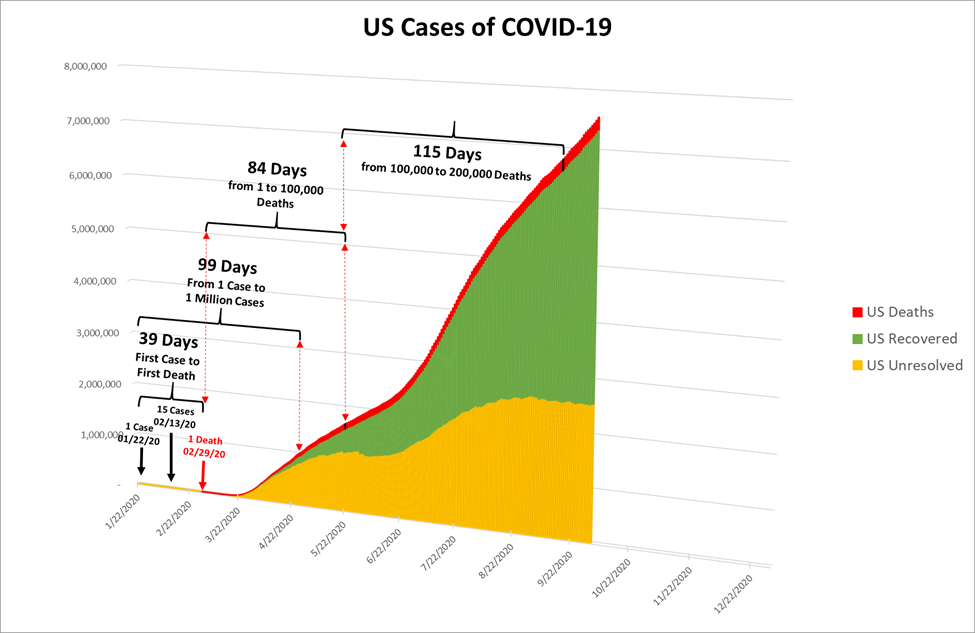
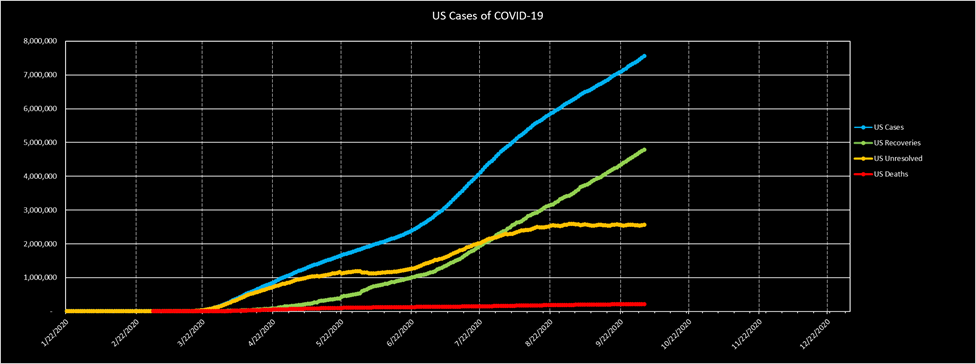
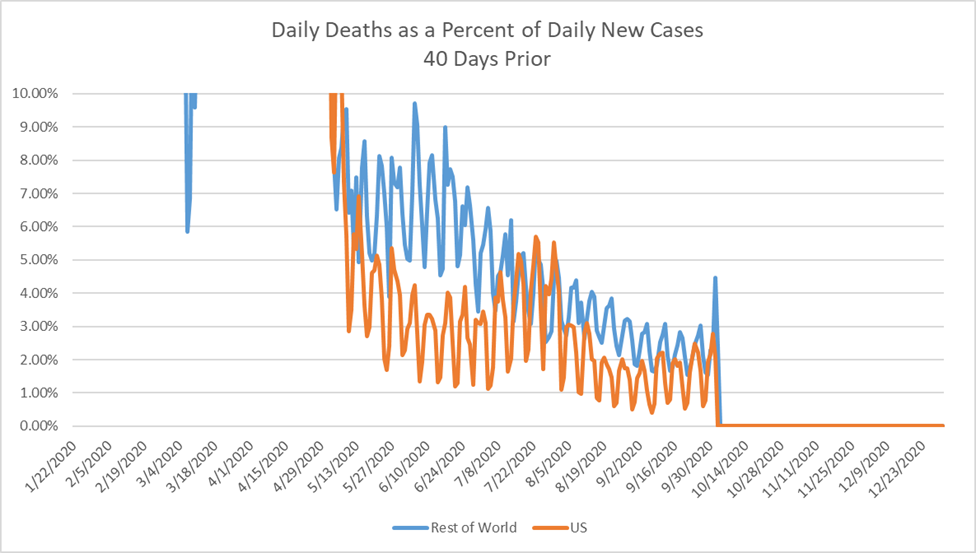
Here are some more graphs you can look at if you’d like.
One reply on “October 3, 2020”
[…] has been three weeks since my last update on October 3 (https://stayhomebewell.org/october-3-2020/). In that post, I alerted you to the fact that the wave in the relative proportions of Recovered […]