April 29, 2020, 10:45 pm
#stayhomebewell for past, current, and future analysis of the COVID-19 pandemic. www.stayhomebewell.org. and www.facebook.com/stayhomebewell. Instagram and Twitter, too. Please react and share on any platform you use. It still matters what people do.
Before we begin, let’s just dispense with today’s idiocy. According to Business Insider https://www.businessinsider.com/new-us-coronavirus-death-toll-models-estimate-deaths-august-2020-4, “The main model used to estimate the impact of the coronavirus outbreak in the United States revised its death toll this week to 74,073 by August 4 — an increase from an April 21 projection of 65,976 deaths by August.”
This is so patently, so obviously, ridiculous that I’m practically rendered speechless.
Actually, I do know what to say. Here is what it is:
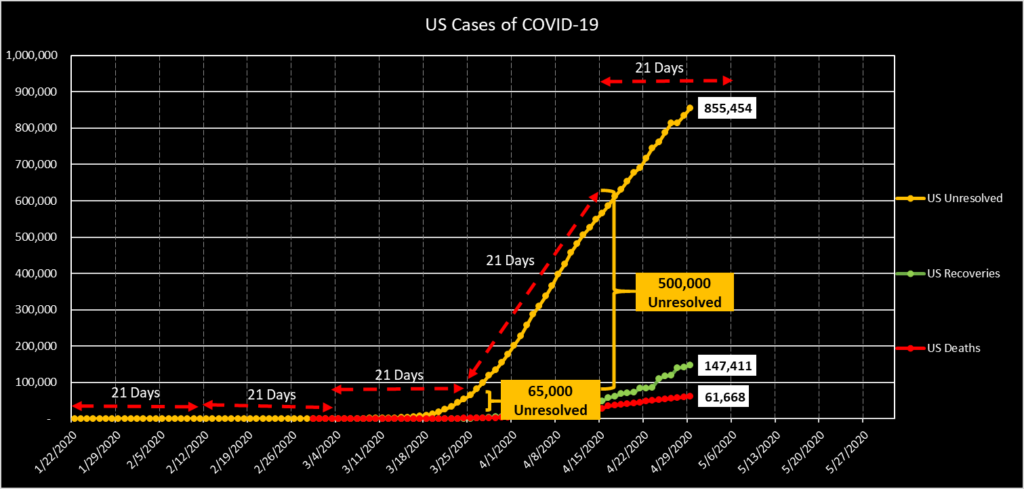
Suppose that NO ONE ELSE in the United States EVER contracted COVID-19 again, starting NOW. There are more than 855,000 Unresolved cases in the country at this moment. The Case Fatality Rate (CFR) in the United States to date is 5.8 percent. It’s so simple YOU CAN DO IT IN YOUR HEAD. One percent of 800,000 is 8,000. Times five equals 40,000. Plus the 60,000 we surpassed today puts us at 100,000 within 30-60 days EVEN IF NEW INFECTIONS DROPPED TO ZERO TOMORROW AND NEVER RETURNED.
Harvard, huh? Jesus fucking Christ.
Global Cases: up 2.61 percent, or 82,051, to 3,220,148. Today marks the second day of increased growth from the low point of 2.24 on April 27. The extended rolling average growth rate is 3.3 percent, down one-tenth of one percent from yesterday. The trough is forming.
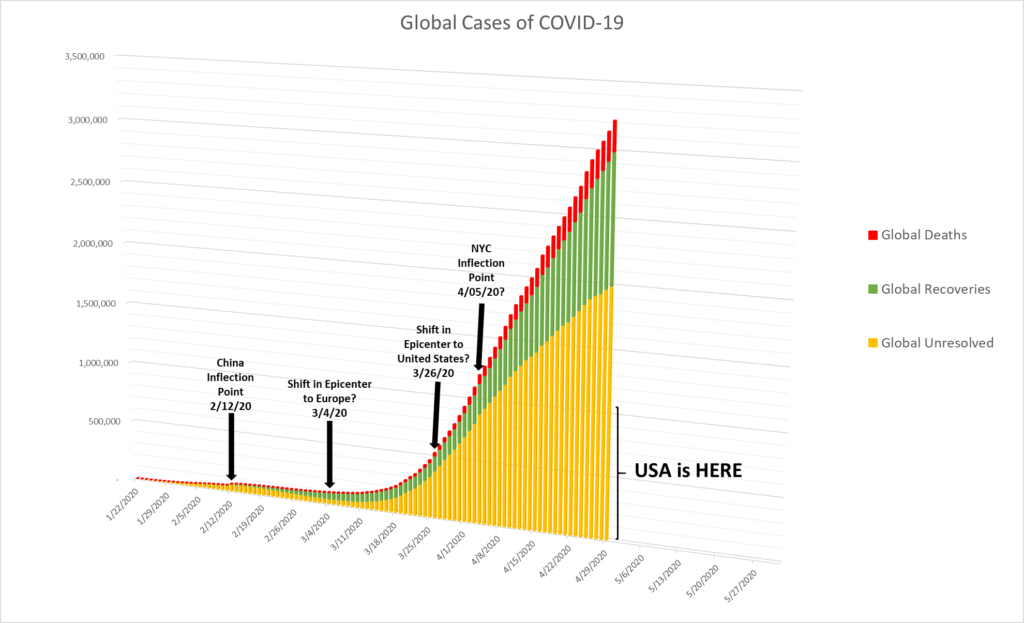
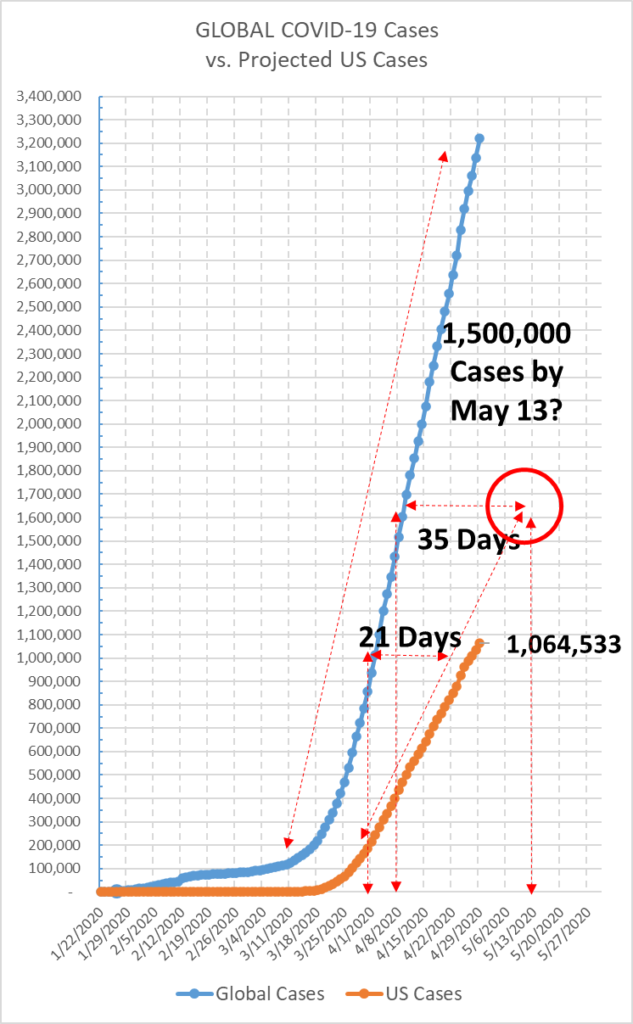
US Cases: up 2.78 percent, or 28,768, to 1,064,533. Since what appears to have been a low point of 2.31 percent in the growth rate curve of April 27, today marks the second day of an increasing growth rate. If the growth rate is higher tomorrow, I think it will be safe to call the formation of the trough and the start of the second wave.
The chart below tracks the figures for the daily rates of change in Global Cases, and overlays the US Cases and their seven-day rolling average trendline. It shows that the growth rate of Global cases decreased for 27 days and formed a trough for 8 days (totaling 35 days). The daily growth rate then increased for 24 days and formed a plateau for 10 days (totaling 34 days). In the 31 days since then, the growth rate has decreased for 31 days, and may be forming a trough now. If the trough persists for four more days before turning upwards, then I think I will have identified a relevant time frame of 35 days for the duration of COVID-19 waves.

On April 23, I projected that the US would reach 1.5 million Cases by May 13. So far, the data appears to be bearing this out.
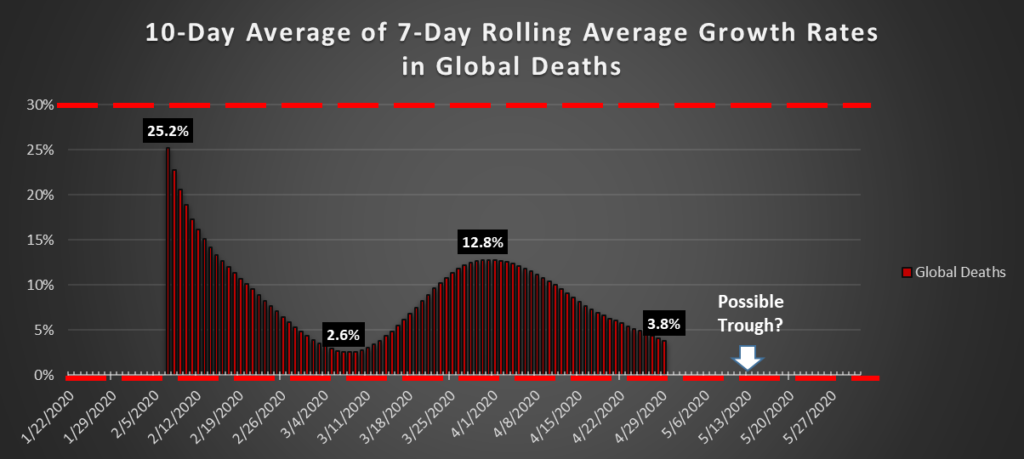
Global Deaths: up 4.7 percent, or 10,247, to 228,215. Today marks the third day of increased growth rates from the low point of 1.83 percent on April 26. The extended rolling average growth rate continues to decrease and is currently 3.8 percent.
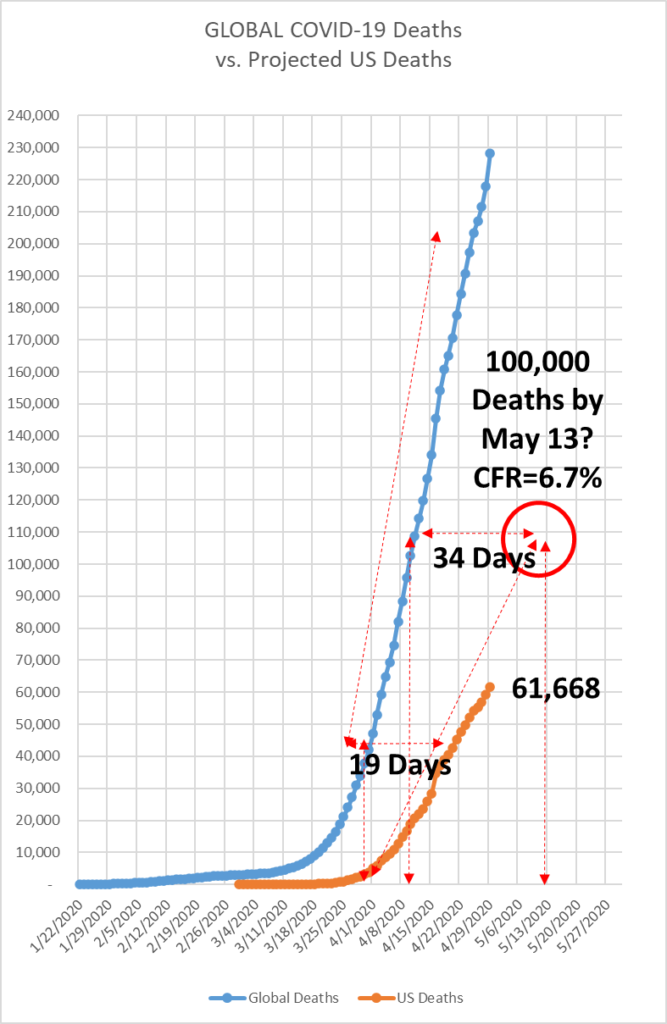
US Deaths: up 4.05 percent, or 2,402, to 61,668. While today’s growth rate is slightly lower than yesterday’s, they are both well above the low point of 2.14 percent set four days ago, on April 26. The extended rolling average growth rate continues to decline, and is at 5.7 percent today. If April 26 marked the bottom of the trough in the growth rate of US Deaths, then the corresponding trough in the extended rolling average should be apparent within 7-14 days. If the growth rate continues to increase by, for the sake of illustration, one half of one (0.5) percent per day, then we will see daily death tolls of 10,000 after only 10 days. If the daily increase were only one fifth of one (0.2) percent per day, we would reach daily deaths of 10,000 after 17 days. And if the increase were only one tenth of one (0.1) percent per day, then it would take 22 days before we reached daily deaths of 10,000. At such a rate, we would reach a total of 100,000 dead by May 13, which is, coincidentally, precisely what I projected on April 23, using an unrelated methodology.
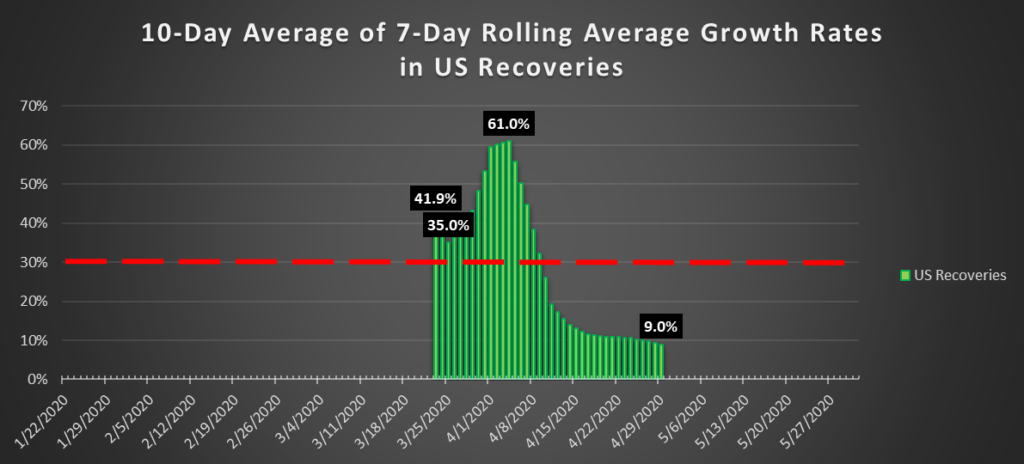
Global Recoveries: up 4.67 percent, or 44,608, to 1,000,303. Yesterday’s growth rate of 3.75 was the lowest in 37 days, a time span that just happens to fall right around the middle of the three-to-six-week time frame that is generally associated with the course of the COVID-19 illness. I am now convinced that these graphs that I’m building are showing the actual physical movement of the virus across the globe.
US Recoveries: up 3.64 percent, or 5,173, to 147,411. The daily fluctuations in this measure are too erratic to be able to draw an inference. The extended rolling average, however, shows a clearly defined trough.
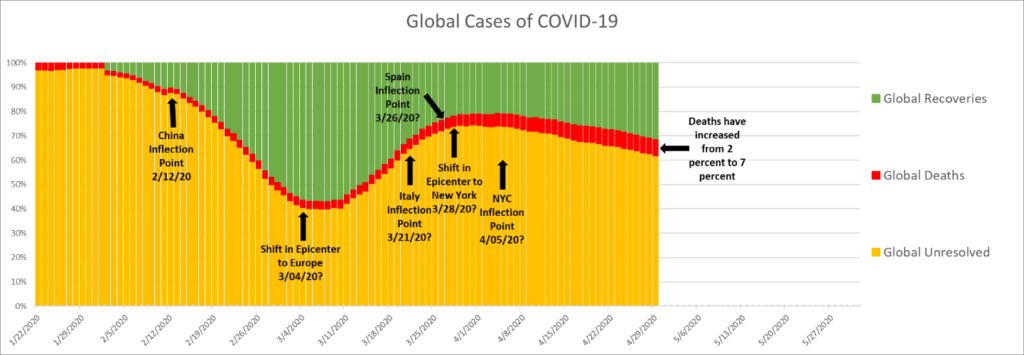
The ratio of Recoveries to Total Cases is increasing, which is a good thing. Recoveries make up 13.8 percent of all Cases, the highest level to date. For context, when this pandemic is over, there will be only Recoveries and Deaths, as there will be no new cases and therefore no Unresolved. The global data shows that 7 percent of Total Cases have resolved in death. This figure is misleading, however, because of the great number of still Unresolved cases.
A more telling figure is also more disturbing. Of the global cases which have had an outcome (or, have “resolved”), 81 percent have recovered and 19 percent have died. In the United States, those percentages are 71 percent recovered and 29 percent dead. This is a harrowing figure. Returning to my hypothetical of zero new infections from this moment forward, that would still predict 248,082 more dead, based on the current number of 855,492 Unresolved. Added to the 61,668 currently dead, that would put the death toll at 309,750. And this horrible figure would be optimistic to the point of total delusion, were anyone to suggest it. Meanwhile, our own government has just revised its projected death toll to 75,000. How quaint.
Global Unresolved: up 1.38 percent, or 27,196, to 1,991,630. The portion of all Cases made up by Unresolved is currently decreasing, as that of Recoveries is increasing. From March 28 to April 6, Unresolved made up 74 percent of all Cases, while Recoveries stood at 21 percent and Deaths accounted for 5 percent. Today, those figures are 62 percent, 31 percent, and 7 percent, respectively. We saw a similar proportion around February 20, as the epicenter shifted from China to Europe. As I have been saying for several weeks, I believe that the current downward trajectory in the proportion of Unresolved cases is due to the wave having washed over New York already, and the next inflection in this curve will be a representation of the gathering of the second US wave of this pandemic. Watch for a plateau in the Recoveries/Trough in Unresolved forming in the coming days, and then a reversal in the direction of the wave.
US Unresolved: up 2.54 percent, or 21,193, to 855,454.
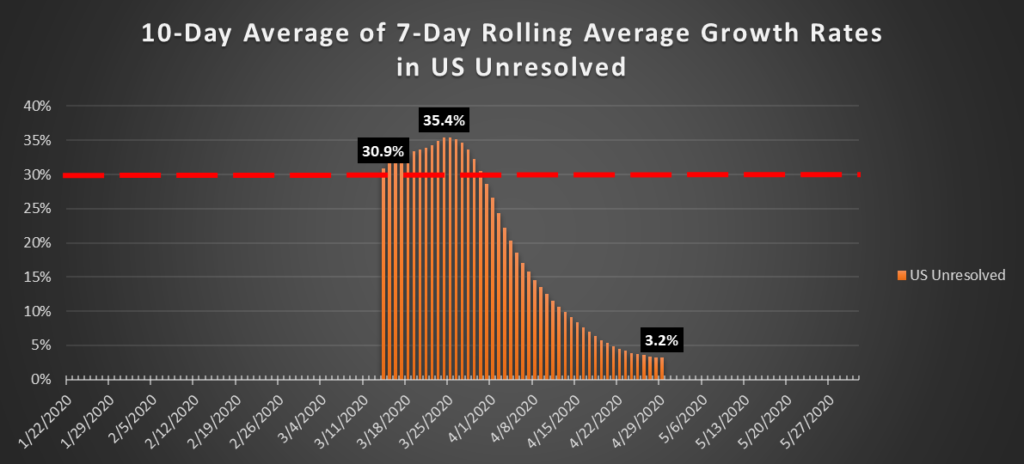
The extended rolling average growth rate is currently at 3.2 percent, and appears to be forming a trough.
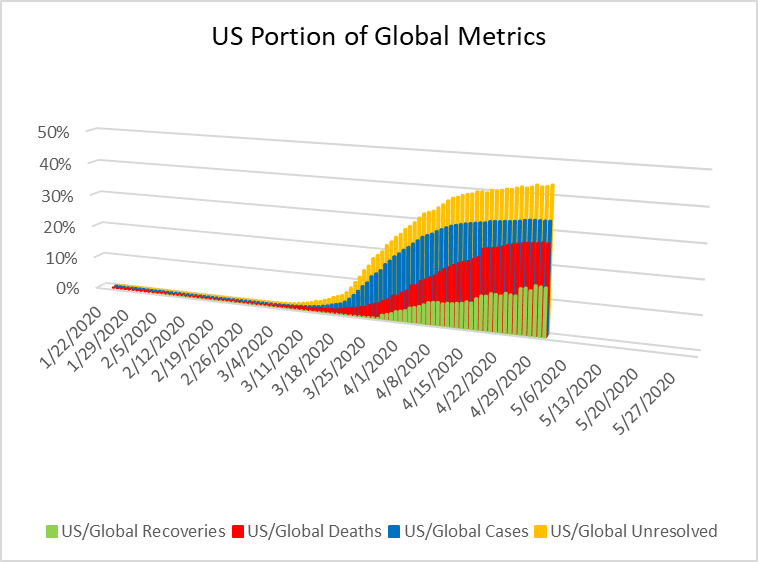
US vs Global: The US currently accounts for 15 percent of Global Recoveries, 27 percent of Global Deaths, 33 percent of total Global Cases, and 43 percent of Global Unresolved. The chart below shows that the growth in these measures has leveled off in the last three weeks, after rising steeply in the three weeks prior to that. As the second wave builds in the United States, I predict that these metrics will grow. However, as the first wave builds in the world’s largest countries beyond China and the United States, we will see our portion of the global numbers decrease.
As ever, please stay home and please be well. And please share this with your network of friends and neighbors on whatever media platforms you use. It still matters what people do.
