April 28, 2020, 9:45 pm
#stayhomebewell for past, current, and future analysis of the COVID-19 pandemic. www.stayhomebewell.org. and www.facebook.com/stayhomebewell. Instagram and Twitter, too. Please react and share on any platform you use. It still matters what people do.
I’m not second-guessing the data, so I’m not attempting any speculation as to whether the numbers are over- or under-estimating the true extent of the pandemic. I’m also not getting into the weeds of how the numbers are collected. I’m simply visiting the worldometers.info website each day at whatever time of day is convenient for me to do this analysis. Therefore, the changes I record from one day to another may be inexact. However, over time, those marginal differences disappear, particularly as I calculate the extended rolling averages in each of these measures.
For those who are new to this blog, I’ll explain what I am referring to as “extended rolling average.” Insofar as daily fluctuations in the various measures (Cases, Deaths, Recoveries, and Unresolved) may be erratic, I first calculated the seven-day rolling averages. However, even those figures produced relatively jagged line curves that are unpleasant to the eye and to the mind. Therefore, I began to calculate the rolling averages of ten seven-day rolling averages and I refer to these as the “extended rolling average.” This produces a smooth curve which takes into account all of the potentially erratic day-to-day changes in a given metric, such that when it changes direction, it is not susceptible to argument that it may represent an anomaly in a short-term measure.
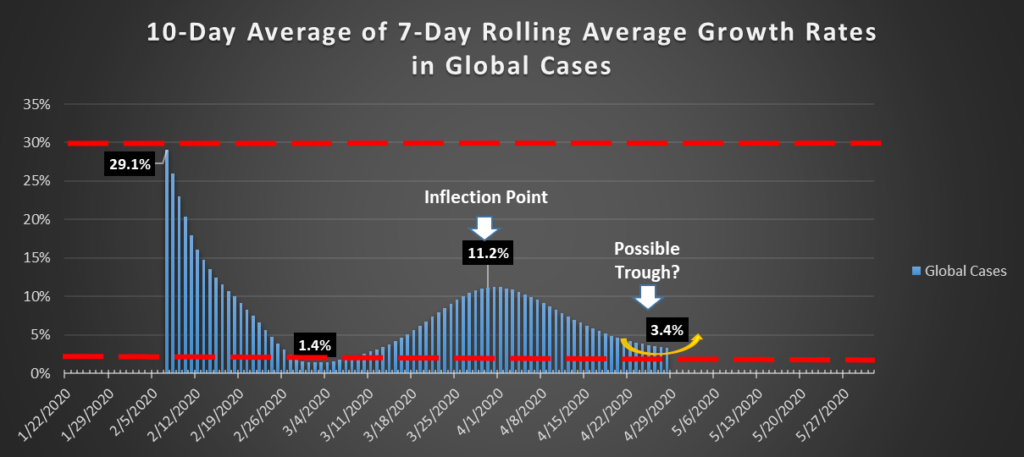
Global Cases: up 2.48 percent, or 76,043, to 3,138,097. Yesterday’s growth of 2.24 percent was the lowest figure since March 2 and may therefore possibly represent the lowest point in the trough that I have been predicting. The extended rolling average has not yet inflected from decreasing to increasing growth rates, but the daily changes in the figure have been growing smaller and smaller, suggesting that we may see a period of a few days’ bottom in this valley before a return to increases. Alternatively, we may see a single day nadir followed by an immediate return to increasing rates. As always, time will tell.
US Cases: up 2.54 percent, or 25,642, to 1,035,765. We passed the one-million mark yesterday, April 27. Ninety-seven days from one to one million.
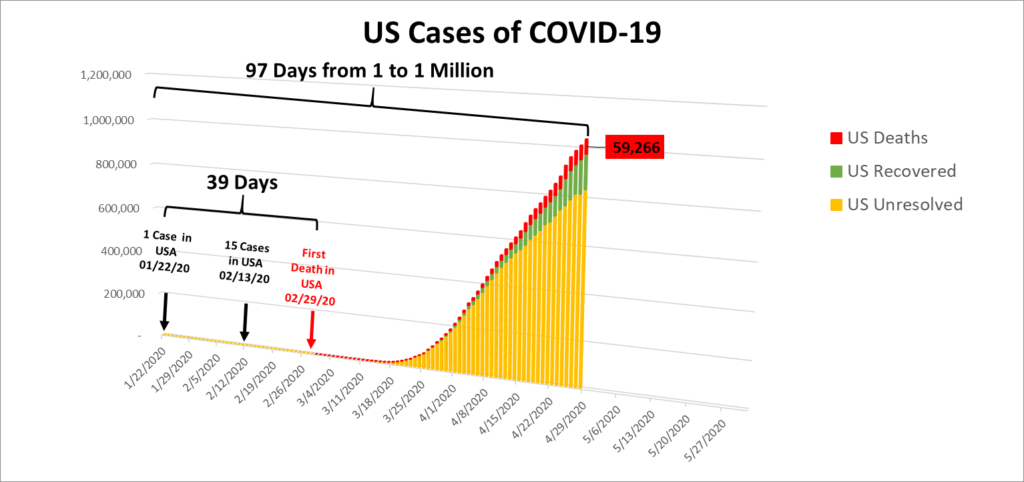
Yesterday’s growth in the US Case count was the lowest in the entirety of the pandemic, at 2.31 percent. Today’s greater increase of 2.54 percent may have marked yesterday as the bottom of the trough.
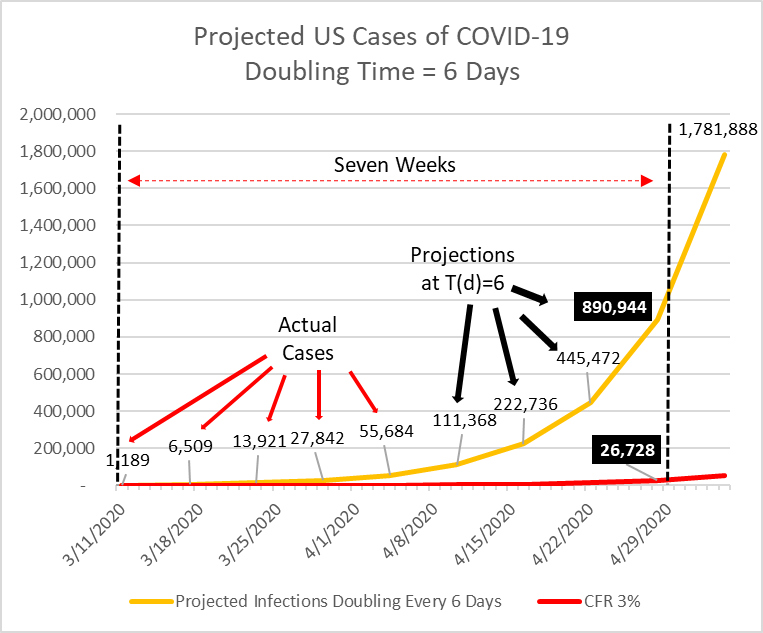
For reference, I’m including a projection that I made on April 4, 2020. At that time, we had 55,684 cases. Projecting a doubling rate of six days, I calculated that by yesterday’s date we would have 890,944 cases and, at a Case Fatality Rate (CFR) of three percent, we would have 26,728 dead. In fact, we reached 880,204 cases five days earlier, on April 23. We reached 26,000 dead nine days prior to that, on April 14. As I’ve said throughout this pandemic, the one consistent feature has been that things have happened more quickly than I have projected.
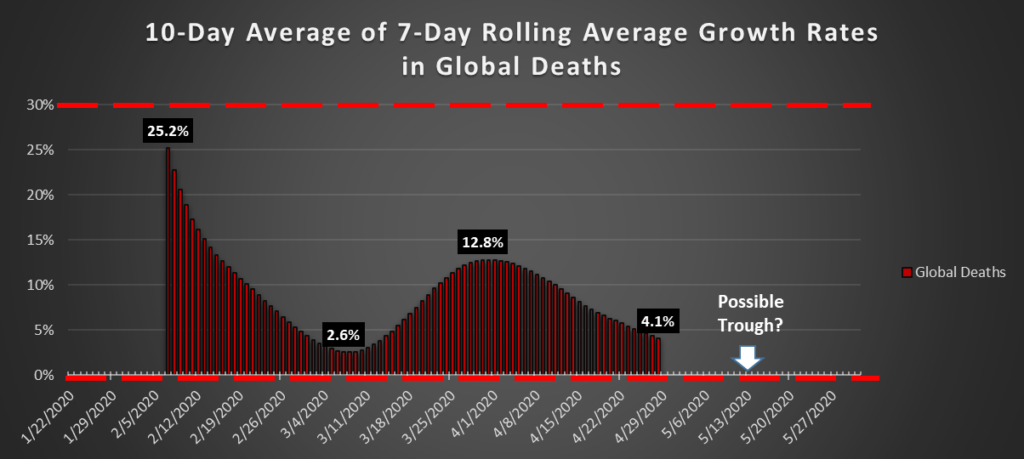
Global Deaths: up 3.1 percent, or 6,535, to 217,968. Two days ago, on April 26, the growth rate was at its lowest, at 1.83 percent. That may represent the nadir of the trough. The extended rolling average is still declining, and is currently at 4.1 percent. The intervals between each day’s growth rate have been getting smaller, suggesting that the bottom is forming now or will form in the next few days.
US Deaths: up 4.35 percent, or 2,470, to 59,266. The US Administration’s rosy projection of seeing a maximum death count of 50,000 having been blown through five days ago, it is now nudging that figure back, first to 60,000, then to 75,000, and today to 100,000 in an offhand “by the way” remark at today’s press event, since 60,000 is literally hours away. The grasping and clawing for every single additional day of happy talk is long since ridiculous to anyone who has been reading this blog. But soon, even the most ardent supporters will be faced with a death toll that they will not be able to ignore. Today’s growth rate marks the second day of increase from a growth rate of 2.14 percent, the lowest rate of growth in US Deaths since the arrival of the pandemic to the United States. The extended rolling average growth rate is at 6.2 percent.
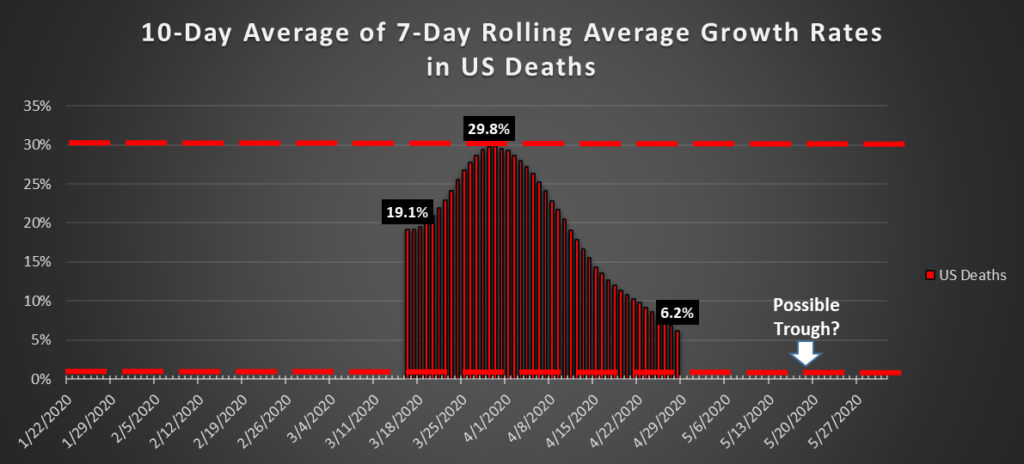
The extended rolling average has not yet made the change in trajectory, but the intervals between daily growth rates is getting smaller, again suggesting the arrival of the trough in this metric. If and when the growth rate returns to a trajectory of increasing growth, over a base of more than 60,000, the numbers will grow to overwhelming levels at an alarming pace.
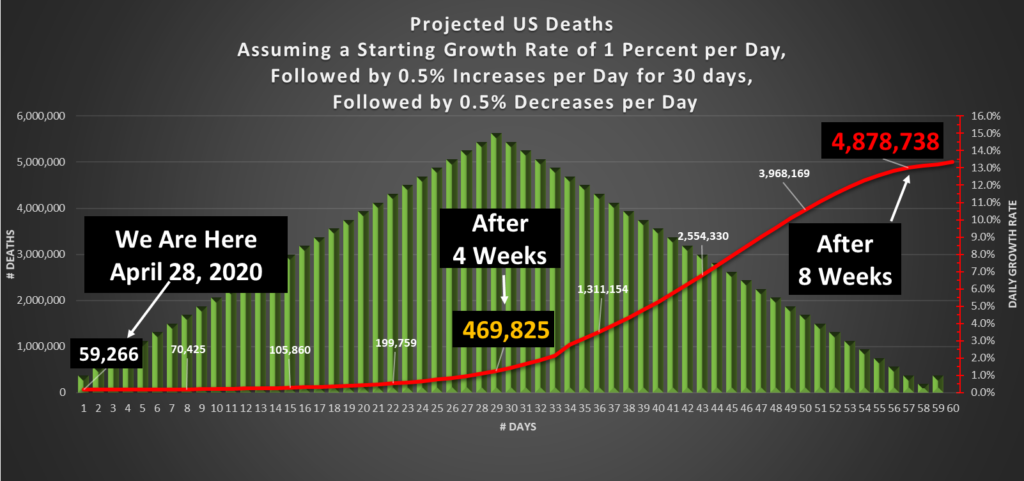
In the chart below, I have projected the daily curve of US Deaths, assuming a starting point of one percent growth (recall that today’s rate was 4.35 percent), and increasing by one-half of one percent each day for 30 days (peaking at a rate of 15 percent), then decreasing again by one-half of one percent each day for another 30 days.
I am not predicting that this will occur. I am merely demonstrating what the numbers would be under such a scenario. It is up to you to evaluate how reasonable the set of assumptions I have chosen to illustrate are. My intention is merely to provide a benchmark.
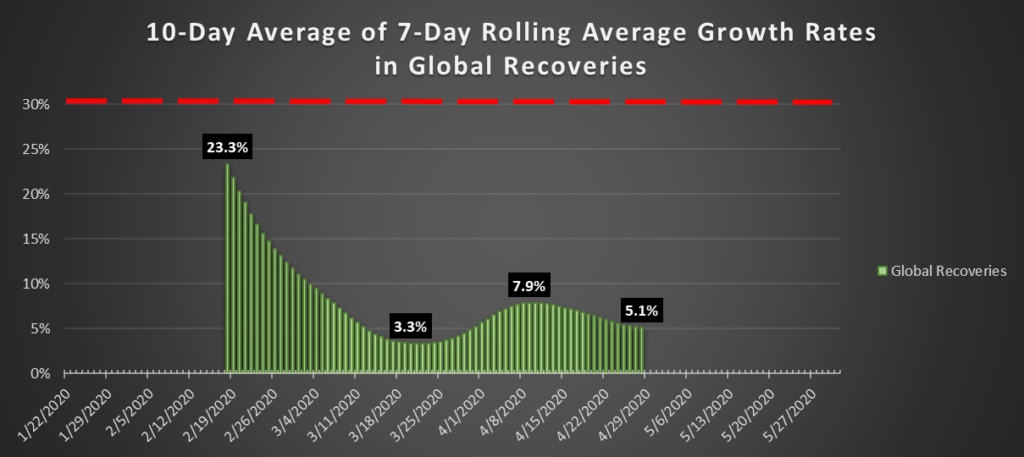
Global Recoveries: up 3.75 percent, or 34,529, to 955,695. The extended rolling average growth rate is 5.1 percent, which appears to be forming the trough I’ve been predicting for several weeks.
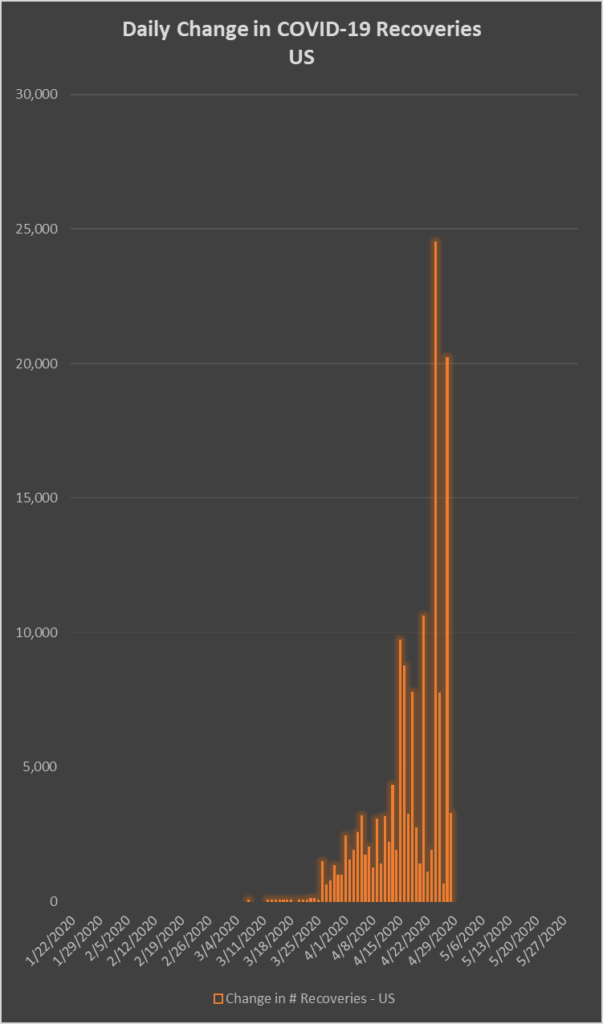
US Recoveries: up 2.34 percent, or 3,249, to 142,238. The numbers each day have shown very large fluctuations, for which I don’t have any explanation.
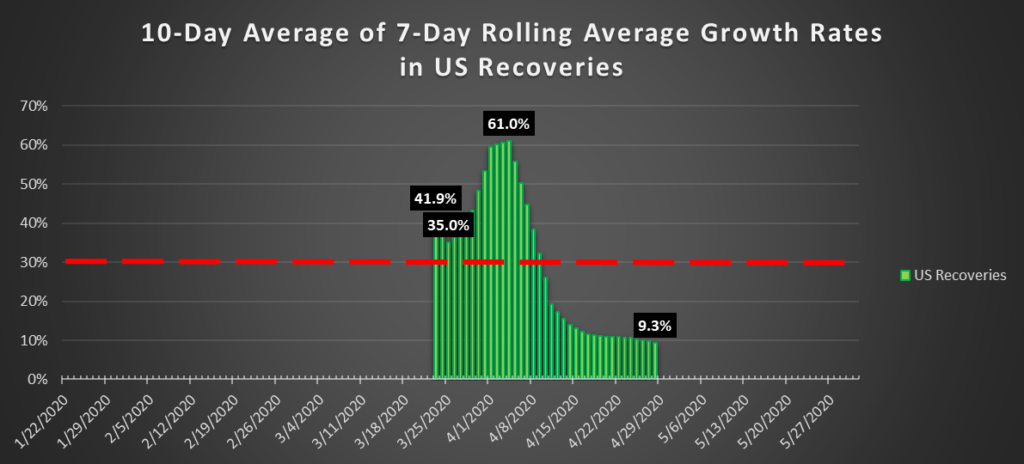
The extended rolling average growth rate in US Recoveries has shown a trough around the level of 10 percent over the last 10 days, but today decreased to 9.3 percent. A decreasing growth rate in Recoveries is a negative development.
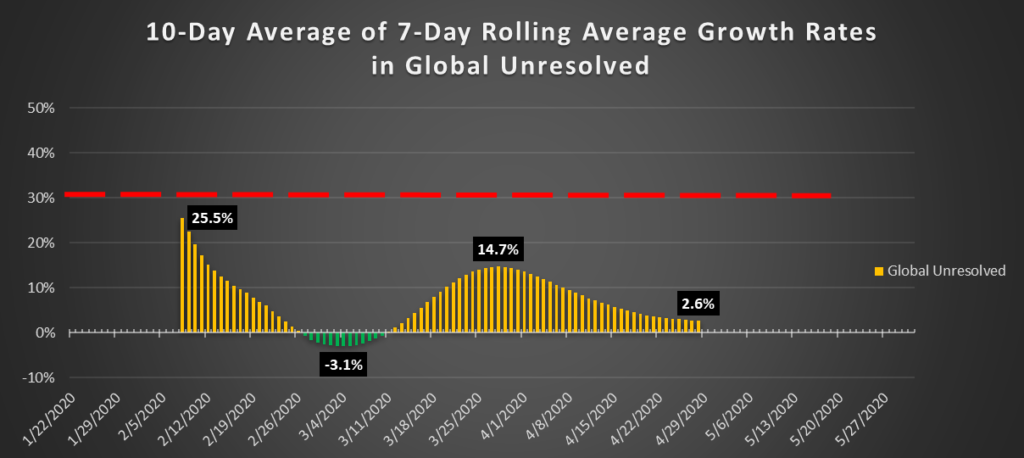
Global Unresolved: up 1.81 percent, or 34,979, to 1,964,434. After emerging from negative growth on March 4 and rising to a peak daily growth rate of 18.83 percent on March 19, the growth rate in the number of Unresolved, or active illnesses, decreased for more than a month, setting the lowest rate yesterday, at 1.07 percent. If the growth rate in Unresolved returns to increases each day, this is a negative development. It points to the possibility of health care systems again facing the prospect of being overwhelmed. The extended rolling average growth rate today is 2.6 percent and suggests the formation of a trough.
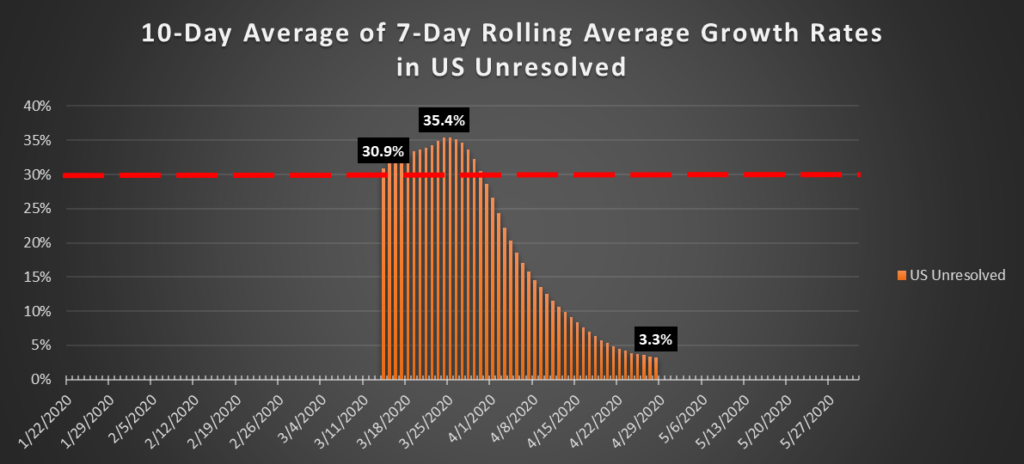
US Unresolved: up 2.45 percent, or 19,923, to 834,261. The extended rolling average growth rate is 3.3 percent and suggests to formation of a trough.
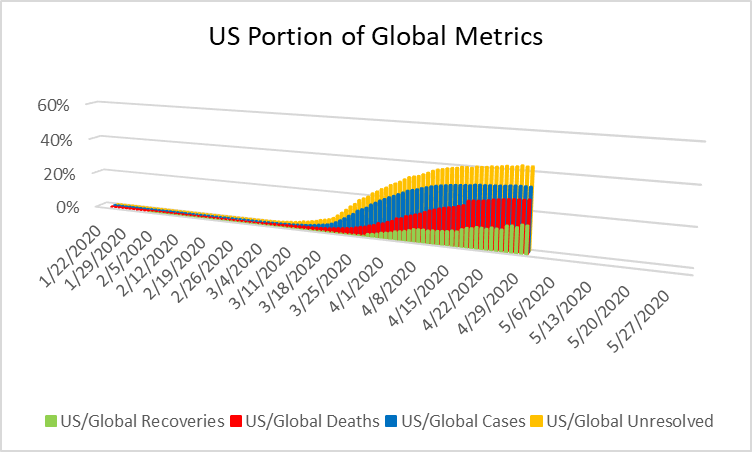
The United States accounts for 42.5 percent of all Unresolved cases in the world today. It accounts for 33 percent of all Cases, 27.2 percent of all Deaths, and nearly 15 percent of all Recoveries to date.
We are not even close to out of the woods yet. Please stay home and be well.
