April 17, 2020, 10:00 pm
#stayhomebewell for past, current, and future analysis of the COVID-19 pandemic. www.stayhomebewell.org. and www.facebook.com/stayhomebewell. Instagram and Twitter, too. Please react and share on any platform you use. It still matters what people do.
I feel like it is irresponsible of me to just keep posting the dry facts about the numbers involved in this pandemic. If you’ve been reading this blog, it’s probably because you can see how you are ahead of the news cycle in your understanding of what is happening. All of my prediction that have had enough time to play out, so far, have proved correct, although I have been off by a couple of days here or there in terms of the exact timing. Still, working with only three figures of publicly available data each day, I’ve plotted events since March 15 with almost perfect accuracy so far.
Part of this accuracy has been due to my assumptions about the behavior of the US populace. If I had assumed that the American people and government were going to do “everything almost perfectly,” I would have made different predictions. But I didn’t make that assumption. I assumed that the American people and government were going to fuck up over and over again. Welp. The numbers speak for themselves.
In addition to being accurate with respect to the numbers, I’ve also been thinking a bit about how this crisis is going to play out. Unfortunately, I am not optimistic. Therefore, I feel I have an obligation to you, my reader. I’m doing all of this analysis each day in order to help you, myself, and everyone to fare better throughout this ordeal. So, if I withhold other advice that could benefit you, I feel that I am doing you a disservice. There’s too much to write about in one night, and I’m writing this introduction after I’ve already done all of the below analysis, so I’m a bit knackered already.
Suffice it to say that the outbreak of COVID-19 in the meat processing plants, the looming threat of strikes among critical supply chain and health care workers at firms like Amazon, FedEx, and UPS, grocery store workers and nurses, have not come as surprises to me. I predicted these developments privately with my friends weeks ago. Since I kept those thoughts to myself, you’ll just have to take my word for it.
But I’m going to begin writing about what I think is going to happen. Stay tuned. And please let me know you’re reading by reacting, commenting, and sharing these posts on whatever media platforms you use. It is very lonely doing this work every day for more than 30 days now, with little feedback. I’m sending out my messages in bottles. Please respond. It still matters what everyone chooses to do, though, in truth, it may already be too late.
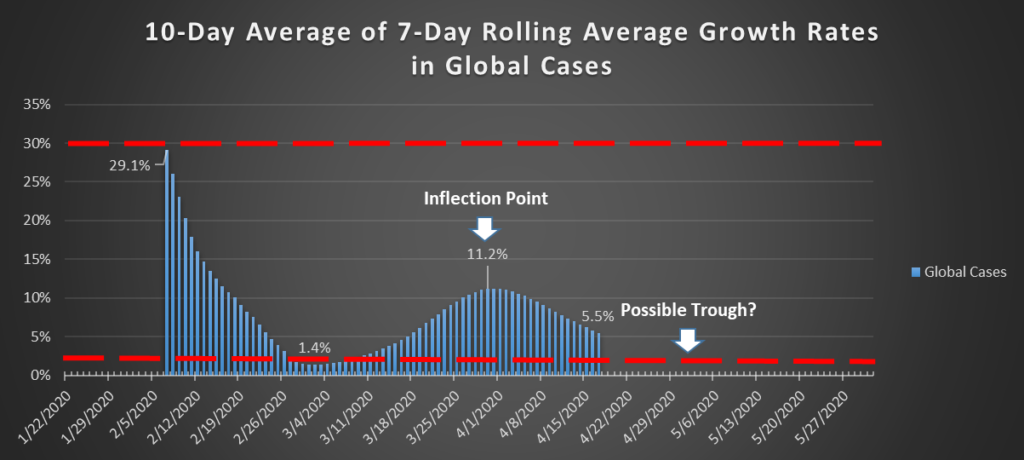
Global Cases: up 3.25 percent, or 70,750, to 2,250,660. Yesterday’s rise of over 105,000 was likely due to the back-inclusion of cases under the CDC’s new guidelines for counting untested but “presumed” COVID-19 cases. Today’s increase is in line with the broader trend, and suggests a continuation of slight slowing in the growth rate. Recall that I commented on April 15, “Don’t be surprised if it turns upward again within the next 7-10 days.”
I use the same charts each day so that the reader will come to understand them more easily with each passing day, and to hold myself accountable to you. I suggested that we might see a trough around May 1. In the words of one prominent daily commentator, “We’ll see what happens.”
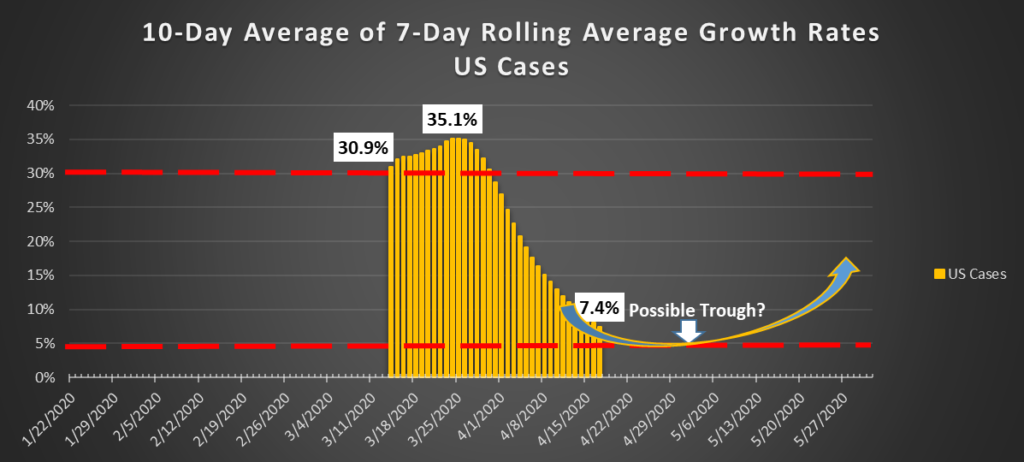
US Cases: up 4.9 percent, or 33,000, to 710,000. That’s 33,000 people entering hospitals or being sent home to ride it out TODAY. The growth in new cases has been declining since March 24, and this has been the statistic that has been the source of much optimism. I wish that I could interpret it in this way. What I see is a likely trough developing in the next 14-21 days, after which we will see a return to a rising growth rate in new cases. This will mark the beginning of the second wave.
Again, I reproduce the graphs you are already familiar with in order for you to watch what develops each day in real time, and to hold my predictions up to scrutiny. One day when this is all over, maybe I’ll be able to use this as evidence of what a fucking genius I am. I’ll be dancing in the streets if and when I’m proven wrong.
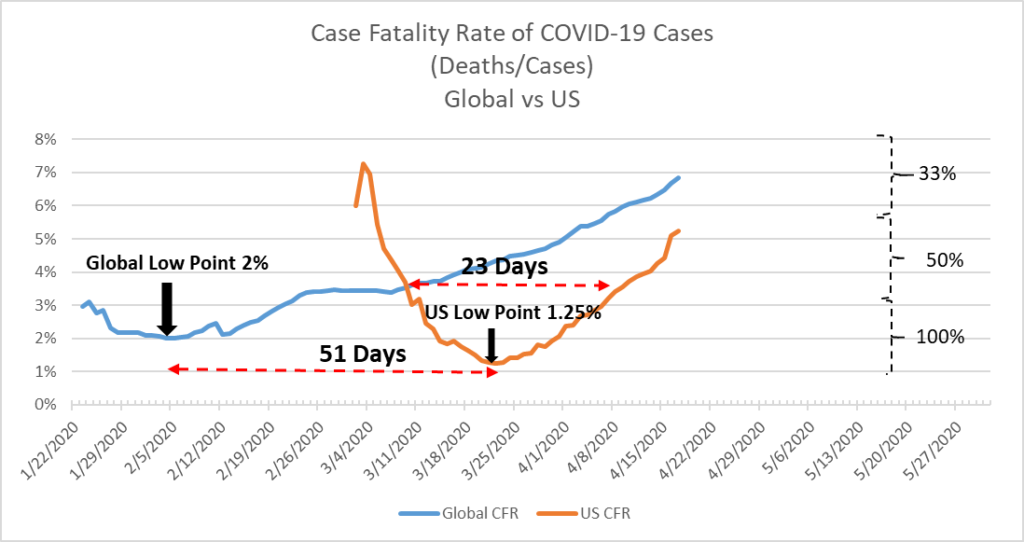
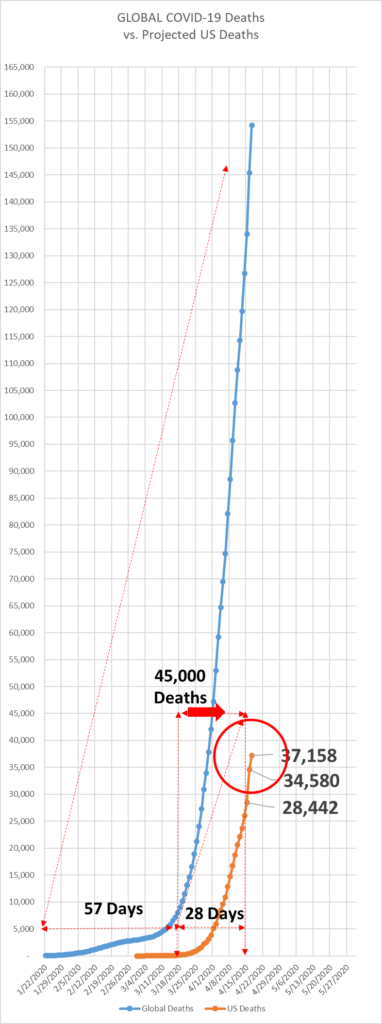
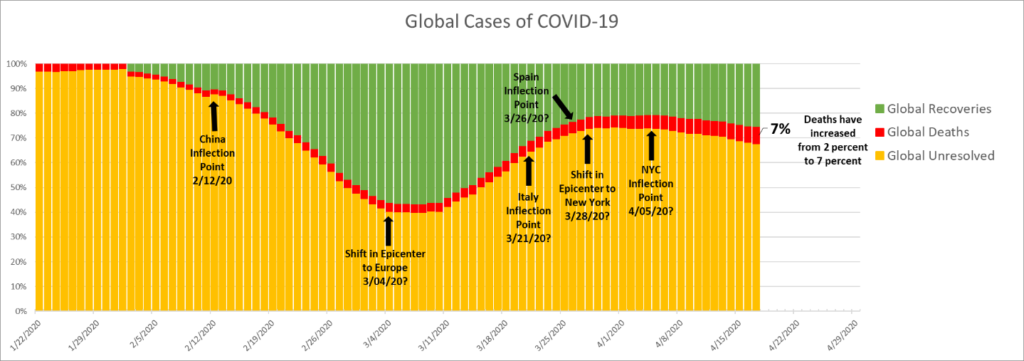
Global Deaths: up 6.1 percent, or 8,845, to 154,250. The global Case Fatality Rate (CFR) is 6.85 percent, rising steadily. This is alarming.
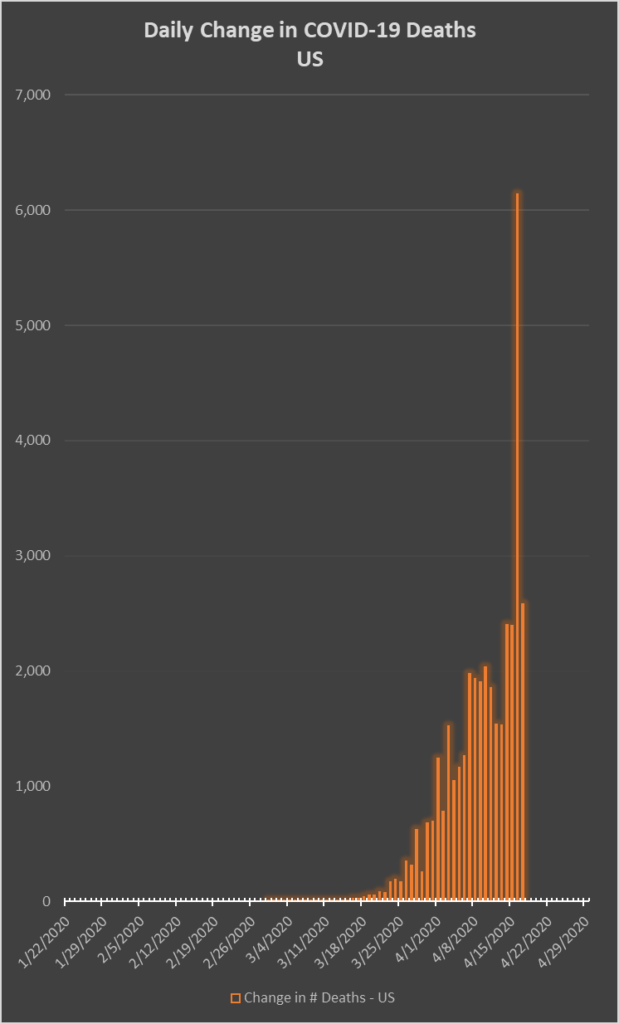
US Deaths: up 7.4 percent, or 2,575, to 37,150 dead in the United States from this virus in the 87 days since January 22. I had predicted 45,000 deaths by April 15. It appears my prediction was about six days early. We will likely hit this number three to four days from now, on April 20 or 21.
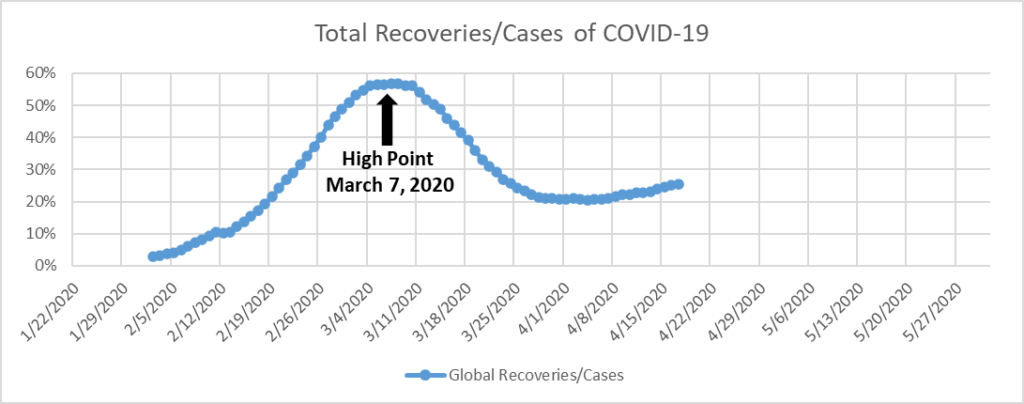
Global Recoveries: up 4.6 percent, or 25,325, to 572,071. The global rate of Recoveries to Cases is 25 percent.
US Recoveries: up 5.7 percent, or 3,240, to 60,510.
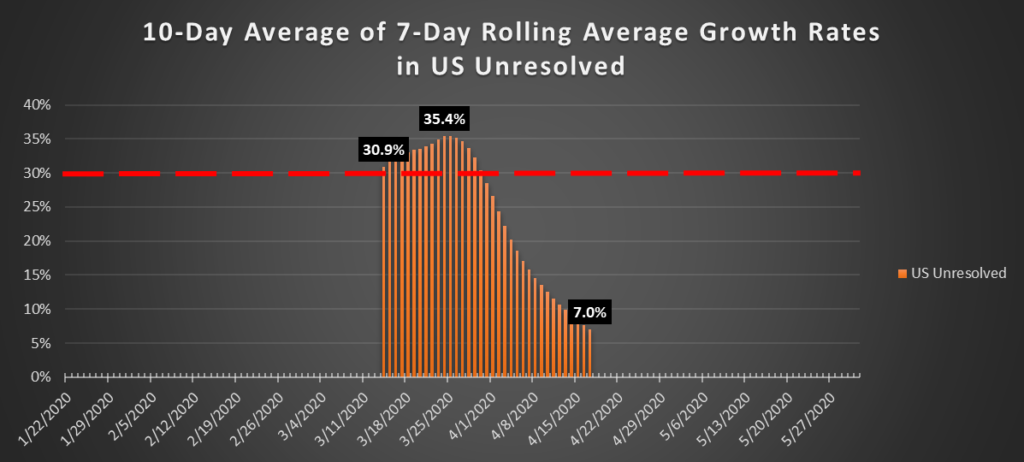
Global Unresolved: up 2.5 percent, or 36,580, to 1,524,330. This graph is important. First of all, I’m marking the 30 percent level in all of the rolling average graphs for two reasons: first, to give perspective to the scale from one chart to the next; and, second, because 30 percent daily growth is exponential and yields a rate of doubling every 3 days.

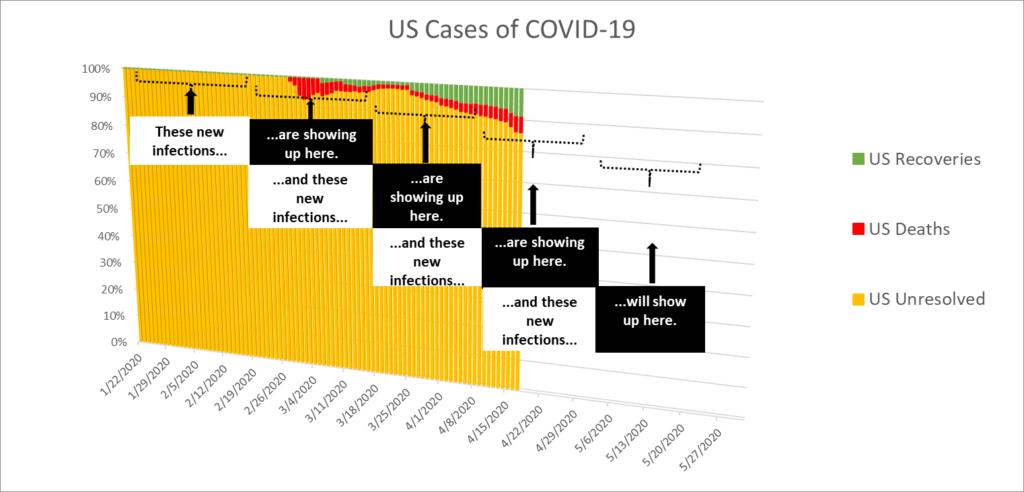
US Unresolved:
While the daily rate of growth has fluctuated, over the 87 days from January 22, the increase from a single death to the 37,150 we have suffered averages a daily growth rate of 13 percent.
Stay home and be well.
