April 2, 2020, 10:00 pm
Click #stayhomebewell for past and future updates on the status of the COVID-19 pandemic.
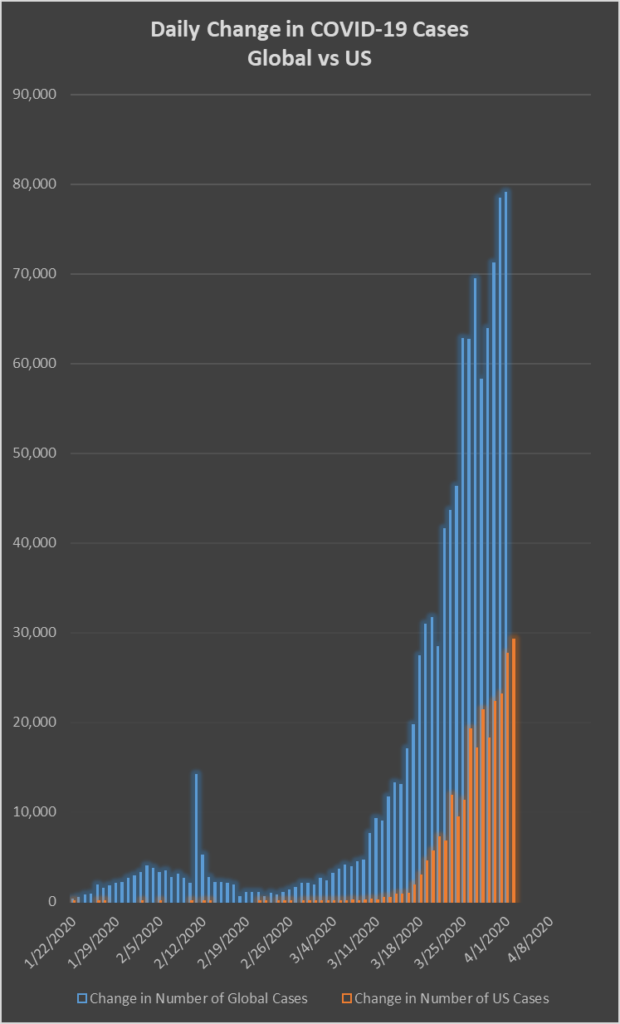
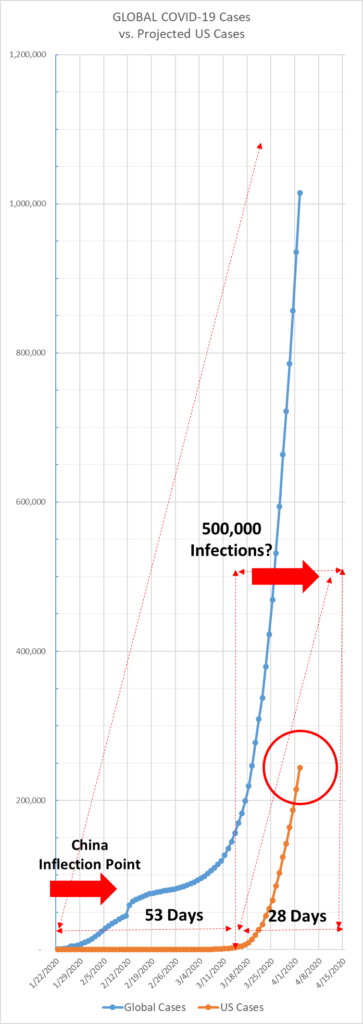
Global Cases: up 8.45 percent, or 79,000 new cases today, to 1,014,300. Today the world is at one million infections. It took 94 days. The 10-day average of the 7-day rolling average daily growth rate is 11.1 percent. (I explained this metric in previous posts, and from now on I’ll refer to it as the “extended rolling average.” It maintains the overall trend but smooths out the curve.) At this rate, the number will reach 2,000,000 in seven days, and 4,000,000 in fourteen days.
US Cases: up 13.6 percent, or 29,225 new cases today, to 244,230. The extended rolling average growth rate is 24.7 percent, which represents the eighth day of slowing growth. A growth rate of 25 percent is horrific, but it is less horrific than a rate of 35 percent, and the fact of its slowing is a good sign, albeit of an improved situation that is still very, very far off in the future (I’m thinking about months, not weeks).
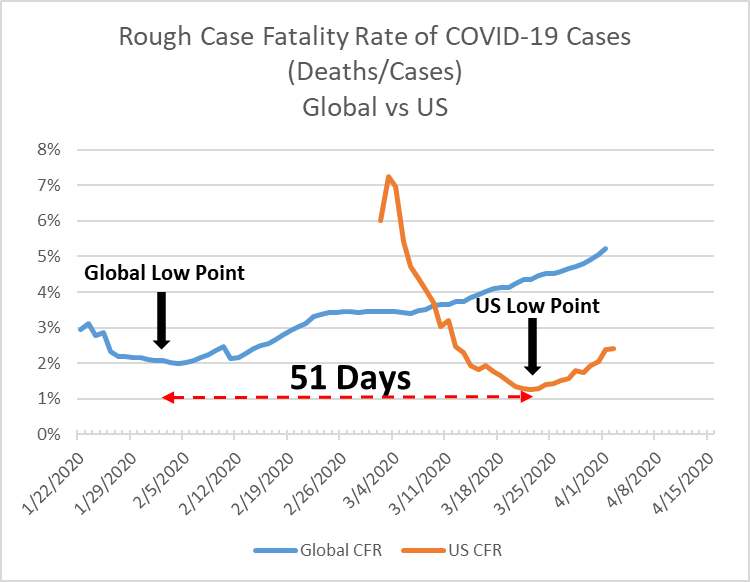
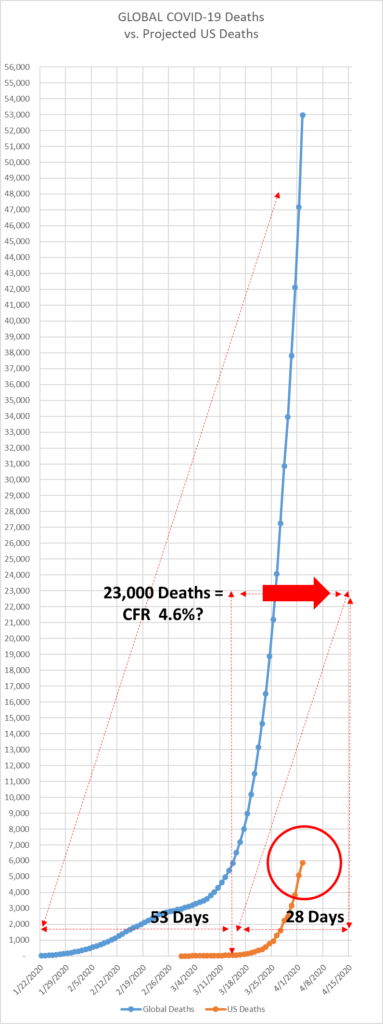
Global Deaths: up 12.25 percent, or 5,790 dead today, to 53,000. The global Case Fatality Rate (CFR) is 5.22 percent. The global CFR has been rising since its low point of 2.0 percent on February 4, 2020. All of my past predictions have been around CFRs of between 1 percent and 3 percent, because higher was too awful to contemplate.
US Deaths: up 15.3 percent, or 781 deaths today, to 5,883. This 15 percent growth is half of yesterday’s growth rate of 32.2 percent. Yesterday’s figure appears to be anomalous, as the number of deaths yesterday was nearly double that of the day before. Today’s absolute number of 781 is much more in line with the trend line, so don’t be misled by a lower growth number today. The US CFR is 2.4 percent, and it has been rising since the March 22 low point of 1.25 percent, ten days ago.
The time lag between the global CFR low point and the US CFR low point is 51 days. On the day after the first US case was identified, January 22, 2020, there were 580 cases globally (mostly all in China, of course). I took that level and saw that the US reached it on March 8, 2020, which was 47 days later. In horseshoes and hand grenades, 47 is pretty close to 51. I don’t know what inference to draw from this coincidence, but the Global CFR increased steadily, from 2 percent to 5 percent. That’s an increase of 150 percent. If the US CFR increases along the same curve as the Global CFR did, then in 41 days from now, or on May 13, the US CFR would be 3.125 percent.
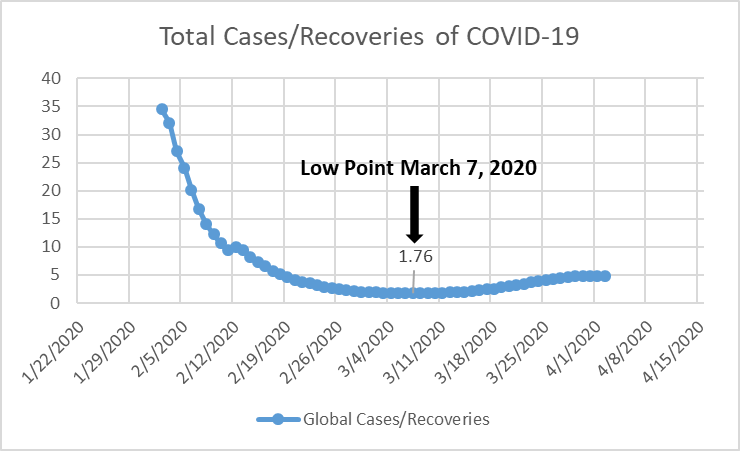
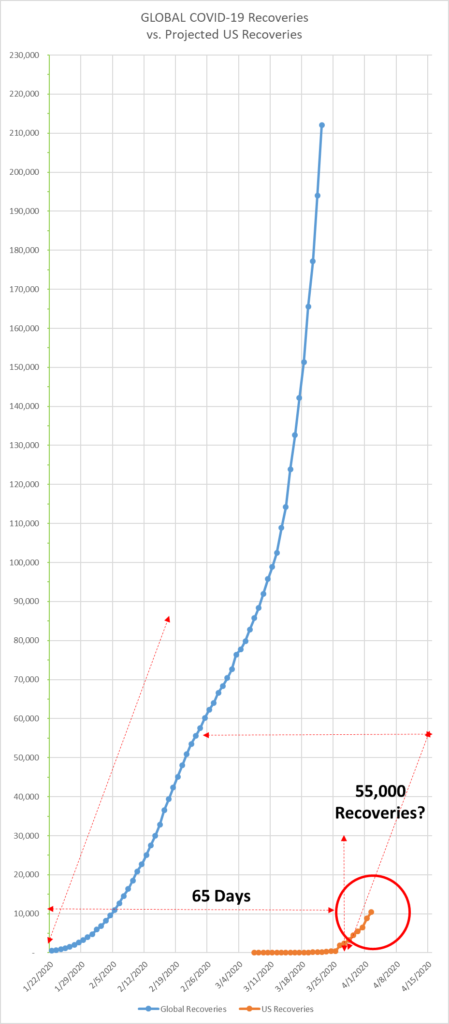
Global Recoveries: up 9.3 percent, or 18,000 patients leaving a hospital today, to 212,000. As of today, the ratio of Cases to Recoveries is 4.78. That is, out of 1,014,300 cases, 212,000 have recovered. This is 21 percent, or just over one-fifth of cases ending in recovery. Don’t be misled by this figure, however. It would seem as though it would suggest that 79 percent, or four-fifths, would end in the alternative to recovery, which would be death. The fact, however, is that almost 750,000 of those one million cases remain Unresolved. The relevant point is the ratio of Cases to Recoveries, which we want to be as close to 1 as possible, as I have explained in previous posts. If every case ended in a recovery, the ratio would be 1. But since some cases end in death, the ratio will by definition be greater than 1. The closer to 1 the ratio, the lower the Case Fatality Rate.
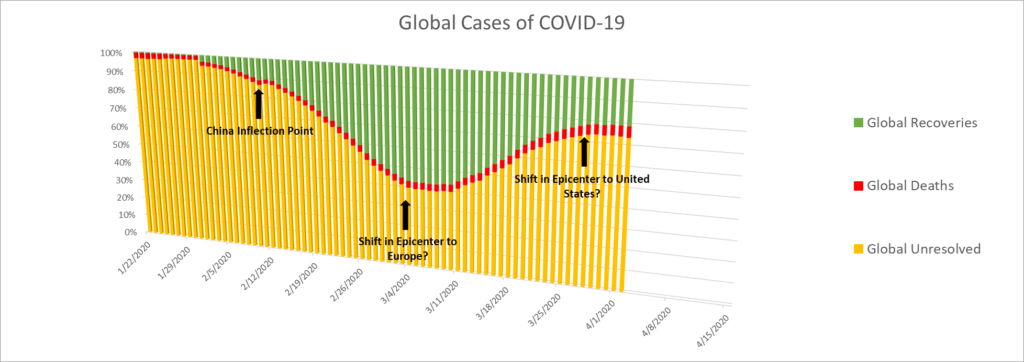
US Recoveries: up 17.2 percent, or 1,525 patients walking out of US hospitals today, to 10,400. Out of 244,000 cases in the United States, ten thousand of them have recovered. The Case-to-Recovery ratio is 23.5, which is a far, far sight from 1.0. The inverse of this ratio is Recovery-to-Cases, which is to say that only 4.25 percent of Cases have recovered to date. At the same time, 2.4 percent of Cases have ended in death. This leaves 93.3 percent of all US cases still Unresolved.
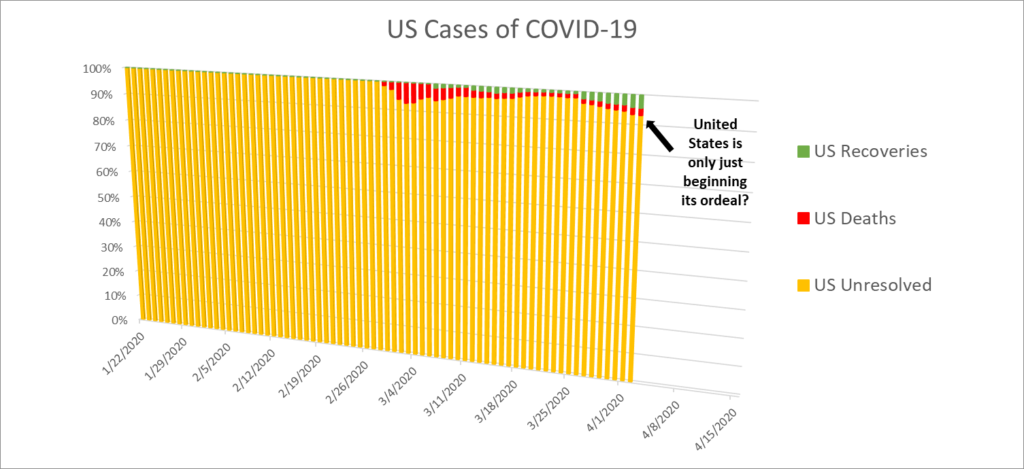
Projection: Each day when I update my spreadsheet with current numbers, it changes the shape of my graphs. The global case number reaching up to and beyond one million is skewing the scale of my axes, and changing the placement of my landmarks and projection lines. That’s ok, it is to be expected. But what it does is force me to bring the graph back into alignment, and that has cause me for a third time to revise my projections upward.
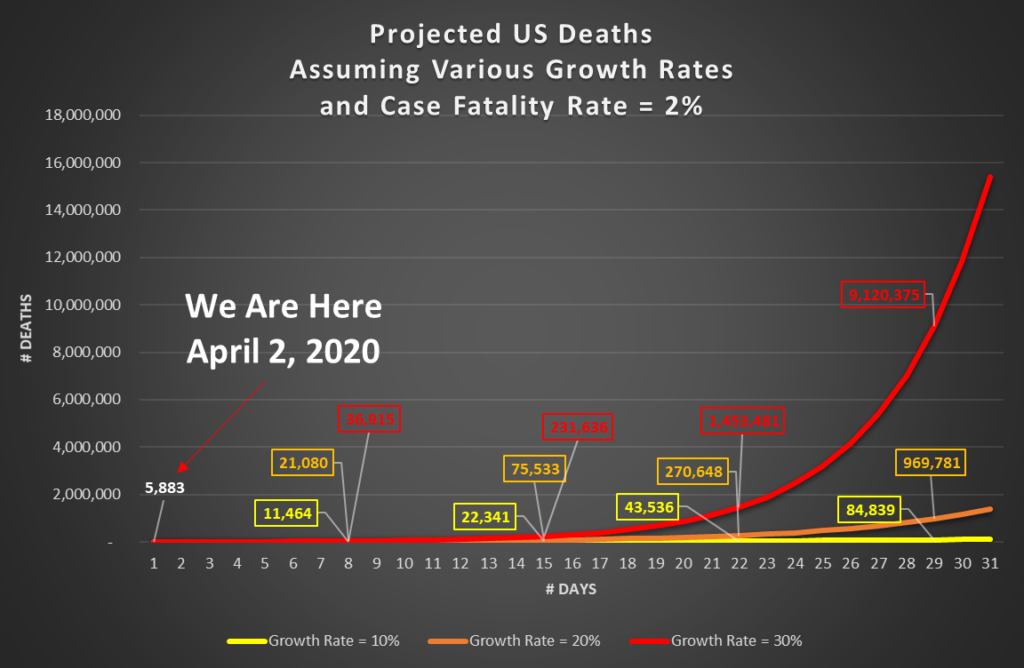
I have two kinds of projection models. One is based on the existing data and an assumption that the shape of one curve will act similarly to the shape of another curve (e.g., US acting similarly to Global, which came before it). I track where it looks like the curve is headed, and pick a number where I think the line will be at a future date. The second is based on assumptions about growth rates and CFR that I establish up front, and then I see what those assumptions do to the curve.
The following three graphs are projections of the first type, regarding US Cases, Deaths, and Recoveries, based on the assumption that the US curve will follow the same trajectory as the Global curves.
On March 15, I first projected 60,000 cases and 2,000 deaths by April 15. That sounded absolutely batshit crazy outrageous at the time. I’ll bet you can’t even remember how you felt back then, all of 18 days ago, can you? Then I had to revise it up to 80,000 cases and 3,000 deaths, and my friends looked at me like I was out of my mind in a tinfoil hat when I told them what the numbers were telling me. Then 80,000 and 4,000 dead. Then 5,000 dead. Then 6,000; 7,000. On March 27, I revised my projection up to 200,000 cases and 11,000 deaths by April 15. By March 31, which was two whole days ago, I had to revise my projection up to 400,000 cases and 15,000 deaths, because it was clear that the emerging curve was racing ahead of my extrapolation from the global curve of 53 days before.
Today, on April 2, I again revise upward, to 500,000 cases and 23,000 deaths by April 15. This would represent a CFR of 4.6 percent. Hopefully, we will also see 55,000 recoveries by that time, or a Case-to-Recovery ratio of 9.1, which would be a whole lot closer to 1.0 than the 23.5 we are at today. I’m afraid I’ll have to spend some time restructuring these graphs with a logarithmic scale. I had been resisting that, because I wanted them to frighten people.
The last graph is a projection of the second type. Here, I take the actual number of deaths recorded today, and project three different outcomes, where one grows at a rate of 10 percent per day, another at 20 percent, and the third at 30 percent. Using this method, by April 16 (two weeks from today), the projected death counts at those levels would be 22,341, 75,533, or 231,636, respectively.
Time will tell. Please stay home and be well.
