stayhomebewell for past and future updates.
To my friends and to any strangers who read this: it would do me a little bit of good to know that someone is reading this, and that it is of some benefit. A few people have let me know that they are, by reacting to or commenting on my posts. But that might be six people, or on a big day, maybe 20 people. If you are reading this, if you could hit any reaction button, that would let me know that my message in a bottle isn’t just floating out to sea for naught.
For those who might be new to my updates: I know absolutely nothing about epidemiology, virology, medicine in general, or much of anything else for that matter. But I sort of know how to plug numbers into a spreadsheet and start dividing one by another and making some graphs.
It is worth reiterating that I am not separating US numbers from the Global numbers. The US is included in the Global. I started doing this when the US numbers were negligible, and the Global numbers were almost entirely accounted for by China. I have not separated Italy, or Iran, or any other country, as I was not that ambitious when I began creating this dashboard. Since that time, I have not gained in ambition. I’m just plodding along, trying to figure out for myself what is going on, and throwing out my messages in bottles, in case anyone else wants to know what is happening like I do. So take it all with a big grain of salt. That said, if you go back and read my posts from March 12 onward, pretty much everything has played out as my Excel sheets have projected. And I have had to revise my projections upward. Twice. Which is bad.
It is also worth noting that I take the numbers as they appear on the Worldometers.info site at the times that I happen to sit down to do this each night, so the numbers are at 10 pm one day and at 8 pm another day. So they are not gospel. But, over time, those small differences are irrelevant.
I’m going to change the format a bit and pair my comparisons, Global to US, rather than listing all Global stats and then all US stats.
Global Cases: up 8.85 percent, or 63,875 new infections, to 785,777. This daily increase is greater in absolute terms than yesterday’s change, but it is not the greatest one day change. The greatest single day increase in recorded new Cases was on March 28, with 69,396.
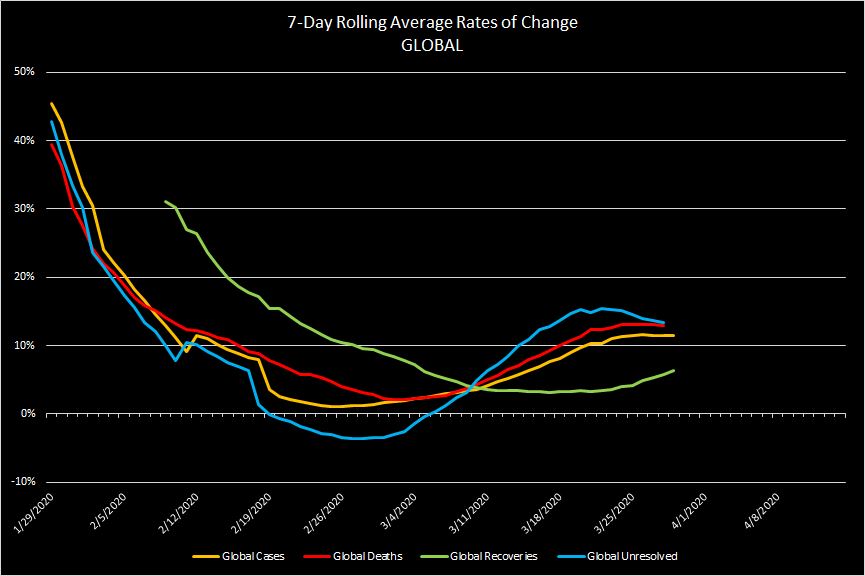
The 7-day rolling average in the growth rate of Global Cases has been above 10 percent since March 21.
US Cases: up 15.7 percent, or 22,250 new infections, to 164,250. The increases of today and yesterday have been the lowest, in percentage terms, since March 1, when the number increased by only 10 percent, from 68 to 75 cases in the entire United States. That 10 percent change represented seven new cases. Ten percent today would be 14,000 new cases. But a slowing in the growth rate, if real, would represent good news. I don’t trust it, though, because there are still so many waves that have yet to land: Los Angeles, New Orleans, Detroit, Chicago, Miami, and basically every single other city throughout the entire country. I expect there will be lulls in the growth rate in the spaces between the waves.
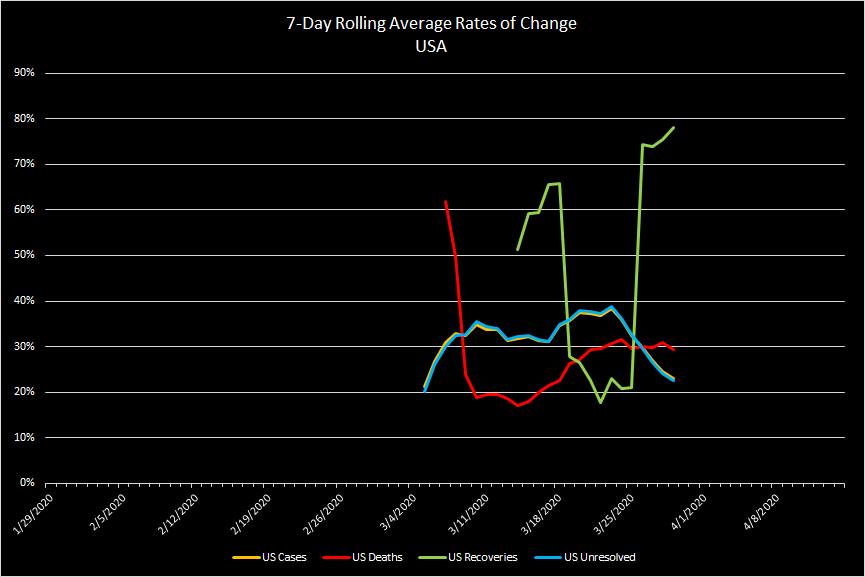
The 7-day rolling average in the growth rate of US Cases is 23 percent, which is the lowest since March 6. This measure has decreased every day for 7 days, from a high of 38.4 percent on March 23. That day’s increase was likely an anomaly, however, because (I think) that might have been the day that NY Governor Cuomo announced his state had begun rolling out large scale testing. So the lower numbers prior to that date may have been skewed to appear lower due to that one day’s spike. Hence, including that peak in the 7-day rolling average might make the last seven days in particular appear to show a trend that is not really a trend. The coming days will tell, as that spike drops out of the rolling average.
Since March 11, when the number of US Cases was 1,189, the doubling rate has been less than three days.
Global Deaths: up 11.3 percent, or 3,850 deaths today, to 37,815. The 7-day rolling average is currently at 12.8 percent. The average 7-day rolling average over the last 10 days has been 12.5 percent. So this seems to be a pretty solid number. We’ll see which way it breaks.
US Deaths: up 27.4 percent, or 681 deaths today, to 3,165. The last four days have seen some pretty wide fluctuations, so I don’t know if this is more about data collection than reality. But the actual deaths over the last four days were 314, then 620, then 257, and now 681. This makes for some dramatic-looking percentage changes.
The 7-day rolling average in the daily growth rate today stands at 29.3 percent, and the average 7-day rolling average over the last 10 days is 29.8 percent. This suggests that today’s rate is indicative of the reality, and that reality is one of exponential growth. The average of these averages over the last 23 days (since there was even data enough to consider) is 27.6 percent. This should be extremely worrying to everyone.
At a daily growth rate of 25 percent, the number 1 would increase to the number 808 in 30 days, and to 652,530 in another 30 days.
At a daily growth rate of 50 percent, the number 1 would increase to the number 191,751 in 30 days, and to more than 36 billion in another 30 days.
At a daily growth rate of 100 percent, the number 1 would increase to over 1 billion in 30 days, and to more than 1 quintillion in another 30 days.
Until now, I have generally tried to keep these data updates extremely dry. Very Joe Friday. Just the facts. But I think it is fair to say that the President of the United States just learned about exponential growth a couple of days ago. Literally.
Because, in fact, it has been 31 days since the first US death. And we have gone from the number 1 to the number 3,165 in that time. Thus, the average daily growth rate has been just about 31 percent. If this rate were to persist, we could expect to see nearly 10 million dead in another 30 days. Ten million would represent three percent of 333 million, which is roughly the entire population of the United States.
THIS IS WHY IT IS IMPERATIVE THAT PEOPLE STAY HOME. This is not politics. It’s just math.
Global Recoveries: up 9.45 percent, or 14,300, to 165,600. The rate of change in Global Recoveries is trending upwards. The 7-day rolling average today stands at 6.3 percent, and has been rising since the low of 3.15 percent on March 17. The low in Global Cases occurred on February 25, which was exactly 21 days earlier. The curves of the 7-day rolling averages of the growth rates of Cases and Deaths have moved almost in lock-step; and the curve of Recoveries follows almost the exact same shape, only lagging by approximately 12 days.
US Recoveries: up 20.8 percent, or 947, to 5,506.
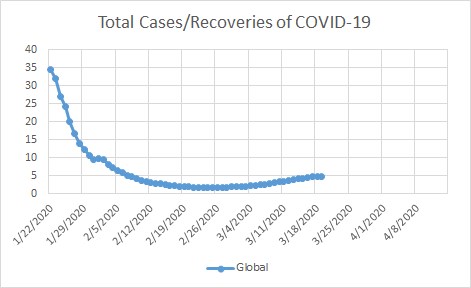
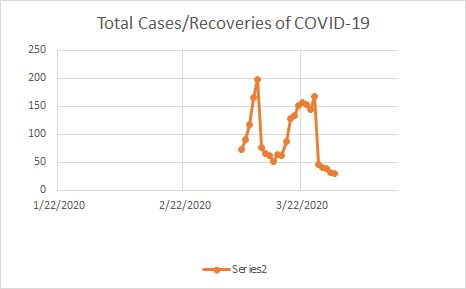
I think that the ratio of Cases to Recoveries is an important one. When there are, say, 100 cases and only 1 has recovered, that ratio will be 100-to-1, or 100. If the number of cases increases to 1,000, and only 5 have recovered, then that ratio will be 200-to-1, or 200. By contrast, if there were 100,000 cases, and all 100,000 recovered, then that ratio would be 1.
Therefore, the lower this number, the better.
Globally, this number stands at 4.74, and has been rising since a nadir of 1.76 on March 7 (23 days ago). This is bad.
In the United States, the number is 30, which is its lowest point to date. The fact that it is declining looks like a good thing. But I don’t trust that it will continue. I suspect that as the virus passes through New York, more cases will recover, bringing the number down; but as the virus then moves through other large cities, we will see the number increase again. The undulations of this curve will likely represent the movement of the virus through various population centers.
Global Unresolved: up 8.5 percent, or 45,730, to 582,355 current confirmed COVID-19 infections.
US Unresolved: The lines of the 7-day rolling average rates of change in US Cases and US Unresolved are identical. The lines of the 7-day rolling average rates of change in US Deaths and US Recoveries are very similar, but there is a lag between Deaths and Recoveries of approximately 12 days. That the lag time between Global Cases and Global Deaths is 12 days, and the lag between US Deaths and US Recoveries is 12 days, surely says something about the course of the COVID-19 illness. If I knew anything about diseases, I might be able to discern what that insight must be. Perhaps you can suggest what it is, because I am either too thick or too tired to work it out.
Finally, filling in one more day of my original March 14th projection graph, I have had to revise my numbers upward for a second time. It was originally built on an assumption of Doubling Rate = 6 days. The actual Doubling Rate has been closer to 3 days. The trajectory of US Cases looks like it could be headed towards 400,000 by April 15, and that of US Deaths could be headed towards 15,000 deaths, which would represent a Case Fatality Rate (CFR) of 3.75 percent.
Please stay home and be well.
