#stayhomebewell for past and future analysis.
March 26, 2020, 9:00 pm
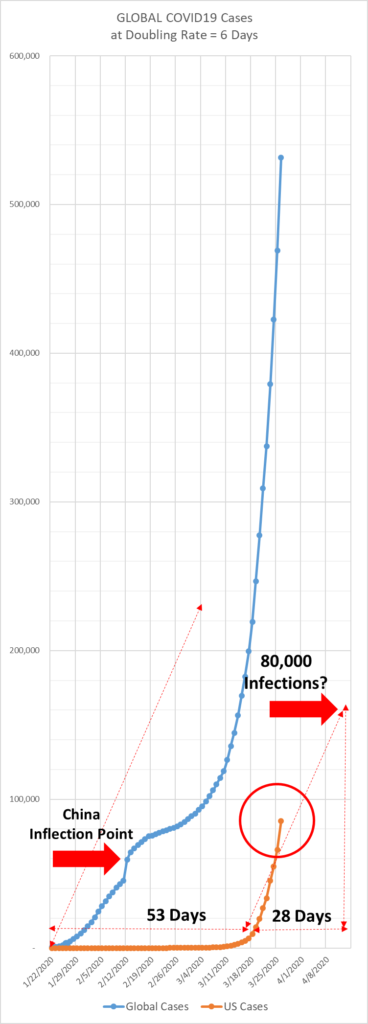
Global Cases: up 13.4 percent, or 62,780, to 531,700.
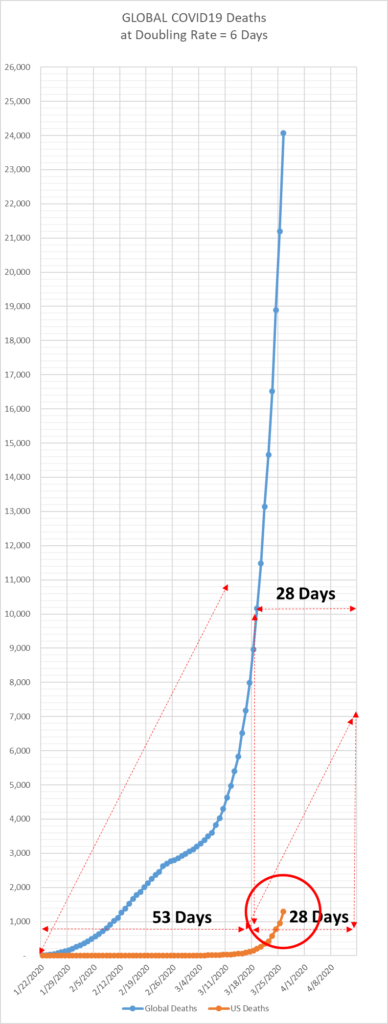
Global Deaths: up 13.5 percent, or 2,900, to 24,100.
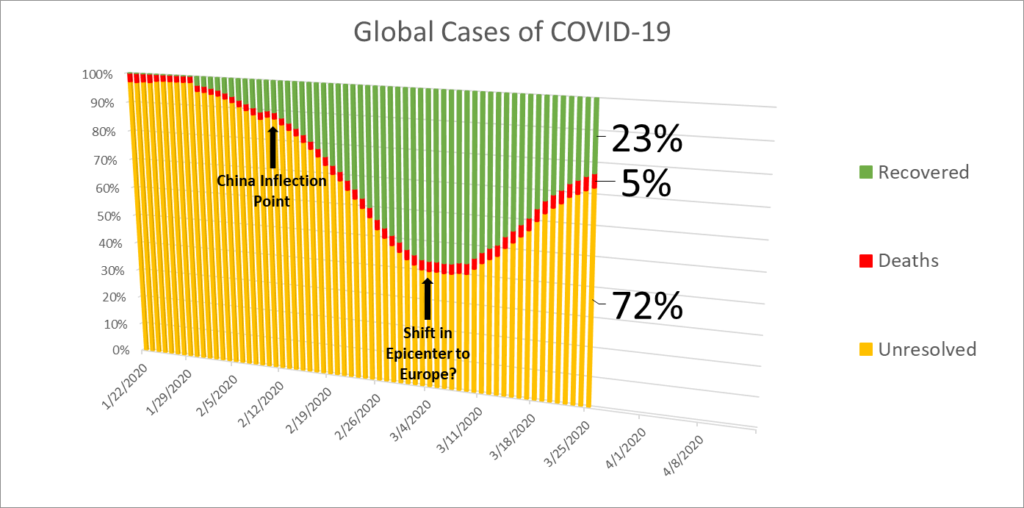
Global Recoveries: up 8.5 percent, or 9,700, to 124,000.
Global Unresolved: up 15 percent, or 50,200, to 383,700.
The relative proportion of the Unresolved cases is at the highest level it has been since February 21, 2020, when China was at the height of its crisis. The hump in the curve appears to be cresting. This is as the number of recoveries in China (75,000), Iran (10,500), Italy (10,400), Spain (7,000), Germany (5,600), and France (5,000). (Between these four European countries, there have been 28,000 recoveries, whereas in the United States, we have fewer than 2,000).
Without really understanding what I’m looking at, I would guess that, if I were studying the European numbers closely (which I have not been), we might see an inflection point in Italy. I suspect that, as this chart fills in day by day, we will see undulations in the curve which reflect that ebbs and flows of the pandemic from country to country.
US Cases: up 29 percent, or 19,200, to 85,300.
US Deaths: up 37 percent, or 350, to 1,300.
US Recoveries: up 373 percent, or 1,470, to 1,865. This has to be something anomalous in the reporting or collection of the data.
US Unresolved: up 27 percent, or 17,400, to 82,100.
The ratio of unresolved cases to deaths and recoveries in the United States is 96 percent to two percent to two percent. This suggests to me that the United States is only at the very start of its ordeal.

I’m not happy to report that, so far, my projections have been almost exactly borne out by the daily emerging data. If anything, the data is progressing slightly faster than my projections had predicted, which is terrible news.
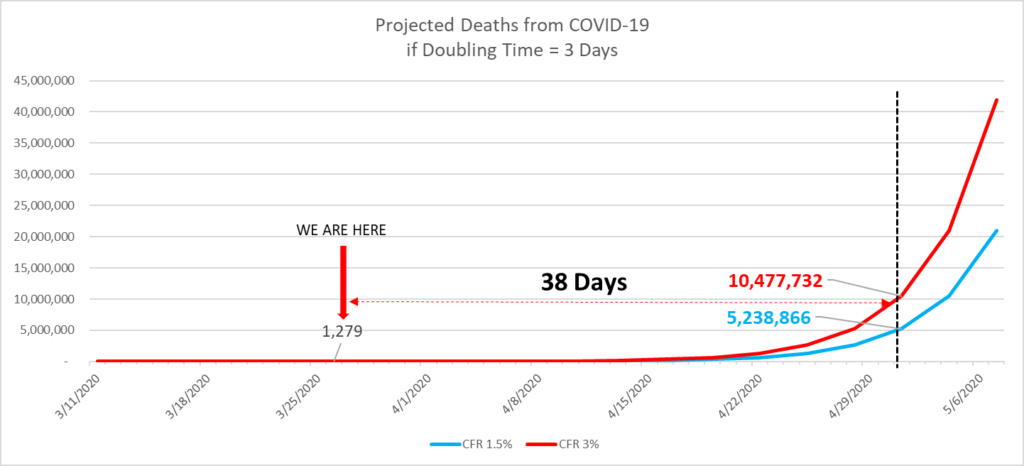
On March 20, when the US had 19,575 cases, I multiplied that number by the growth rate that had been present in the Global data set at the corresponding level. That produced a curve on a graph which suggested what the future days might hold in store for the United States. I then took two percent of that number as a projected number of deaths. Each day, I have been substituting the actual day’s number for the projected number for that day, which then changes the rest of the curve. Based on today’s figure, the projected number of deaths was to have been 1,705. The actual number was only half a day behind, at nearly 1,300. At today’s number of 85,000 cases, a CFR of 1.5 percent yields a death toll of 1,279. The number of deaths will reach and almost certainly surpass 1,705 tomorrow.
Below are two views of the actual current US data:
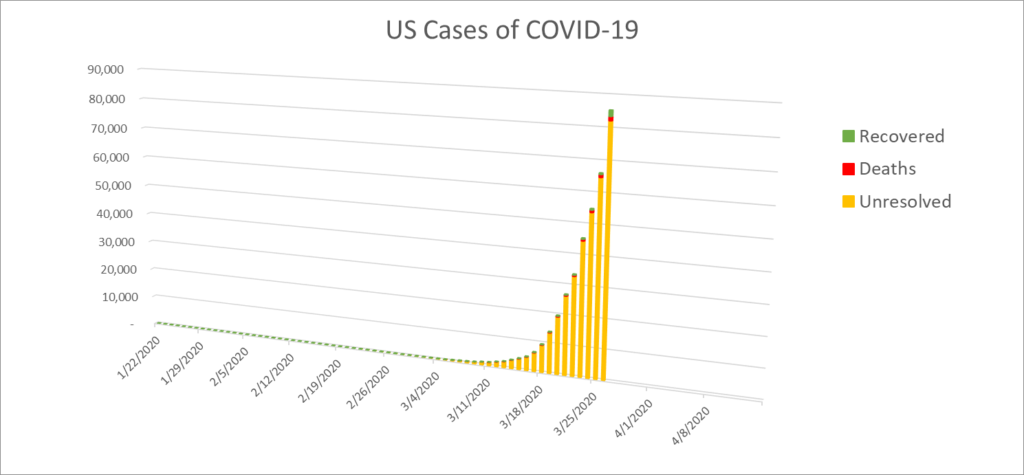
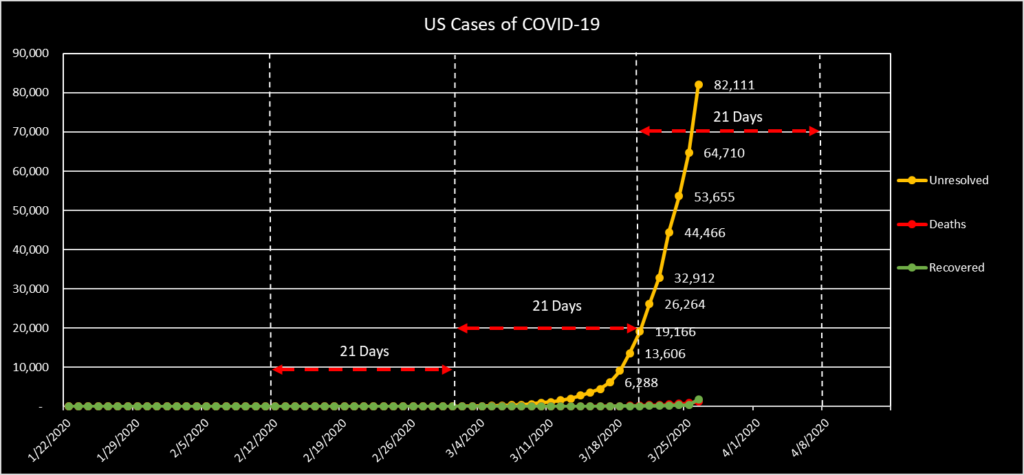
The 7-day rolling averages for the increases in Cases and in Deaths remain above 30 percent. As I have stated before, such a growth rate is associated with exponential growth, or a doubling approximately every three days.
Filling in the daily points on the first projections I made on March 12:
